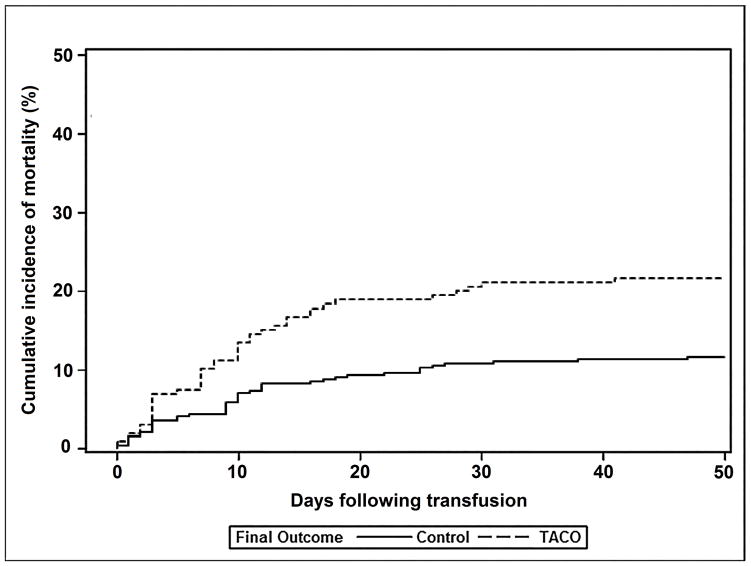
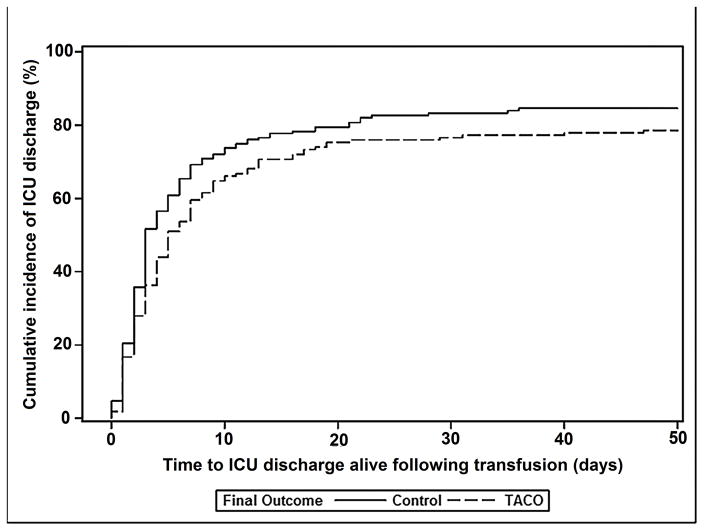
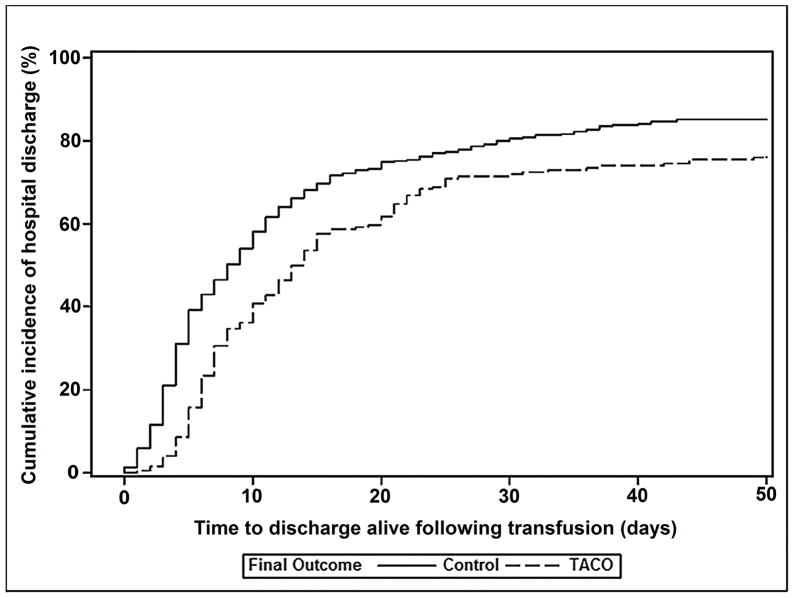
Figure 1.
Cumulative incidence of in-hospital mortality (Figure 1a), being discharged alive from the intensive care unit (Figure 1b), and being discharged alive from the hospital (Figure 1c) for TACO cases (dotted line) and transfused controls without pulmonary edema (solid line). Analyses counted from the time of transfusion until death or discharge at 50 days.


