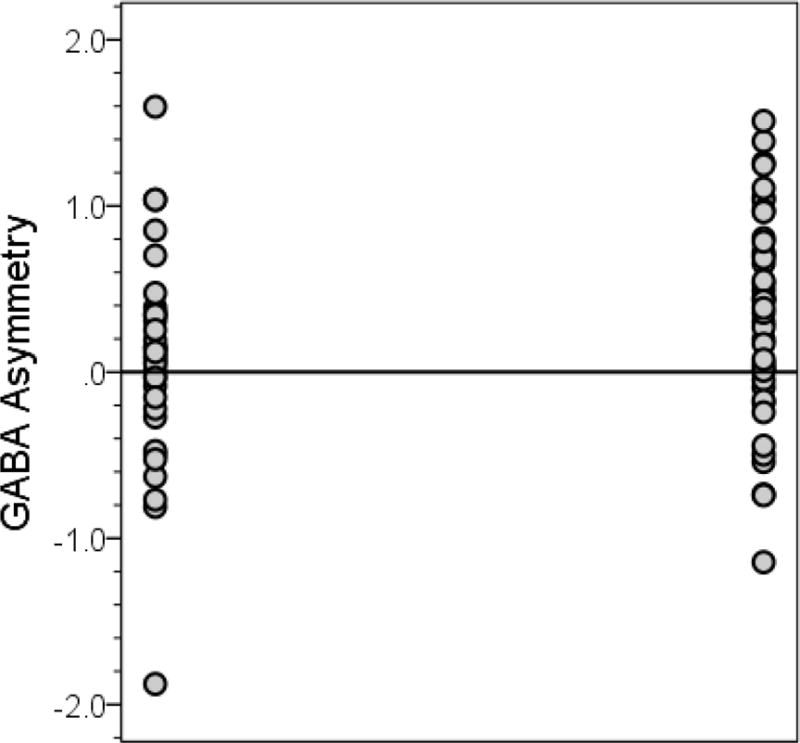
Figure 3.

Dentate GABA asymmetry in controls (left) and ET cases (right)
The mean value of GABA asymmetry (right dentate GABA concentration minus left dentate GABA concentration) was 0.34 ± 0.62 in ET cases (values on right) and 0.07 ± 0.62 in controls (values on left) (for case-control comparison, p = 0.05). The horizontal line at zero indicates a point in which the GABA concentration in the left and right dentate are equal. Values above the line indicate that the right dentate GABA concentration is greater than the left; values below the line indicate that the left dentate GABA concentration is greater than the right.
