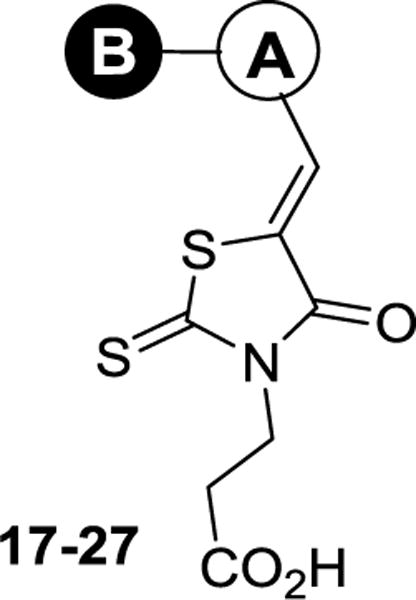
Table 2.
Structure features, calculated properties, KD values of compounds 17–27

| ||||
|---|---|---|---|---|
| cmpd | A–B | LGFEa(kcal/mol) | LEa | KDb(μM) |
| 17 |
|
−31.1 | −1.24 | 20±2 |
| 18 |
|
−29.8 | −1.19 | 3.3 ± 0.9 |
| 19 |
|
−31.8 | −1.22 | 7.0 ± 2.7 |
| 20 |
|
−30.5 | −1.17 | 6.5 ± 1.3 |
| 21 |
|
−31.4 | −1.21 | 1.2 ± 0.2 |
| 22 |

|
−32.6 | −1.13 | 7.4 ± 0.6 |
| 23 |
|
−30.9 | −1.10 | 28 ± 6 |
| 24 |

|
−28.9 | −1.00 | 6.5 ± 1.0 |
| 25 |

|
−30.7 | −1.10 | 7.6 ± 1.1 |
| 26 |
|
−30.1 | −1.16 | 13 ± 1.4 |
| 27 |
|
−28.7 | −1.15 | 1.1 ± 0.2 |
Ligand Grid Free Energy (LGFE) and Ligand Efficiency (LE) calculated with SILCS.26
The listed result was the average of three independent experiments.
