
Figure 1.
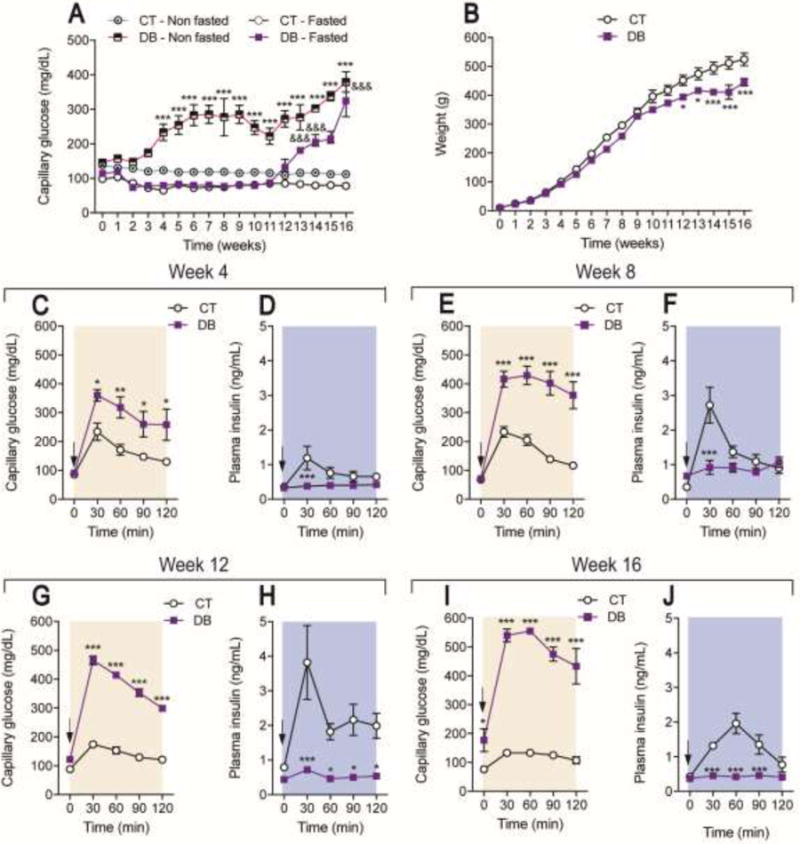
Characteristics of the neonatal streptozotocin (nSTZ) induced diabetic rat model. (A) Time course of capillary glucose concentrations and (B) body weight from control (CT) and diabetic (DB) rats. Data in panels A and B are the mean of 10 animals ± SEM. Capillary glucose levels (C, E, G, I) and (D, F, H, J) serum insulin concentrations before and during an oral glucose tolerance test in control and diabetic rats. Black arrows indicate the time of glucose (2 g/kg) administration. Data in panels C-J are the mean of 5 animals ± SEM. (A) ***p < 0.001, significantly different from the control-non fasted group and &&&p < 0.001, significantly different from the CT-fasted group, as determined by two-way ANOVA followed by the Bonferroni test. (B-J) *p < 0.05, **p < 0.01 and ***p < 0.001 significantly different from the CT-group, as determined by two-way ANOVA followed by the Bonferroni test.