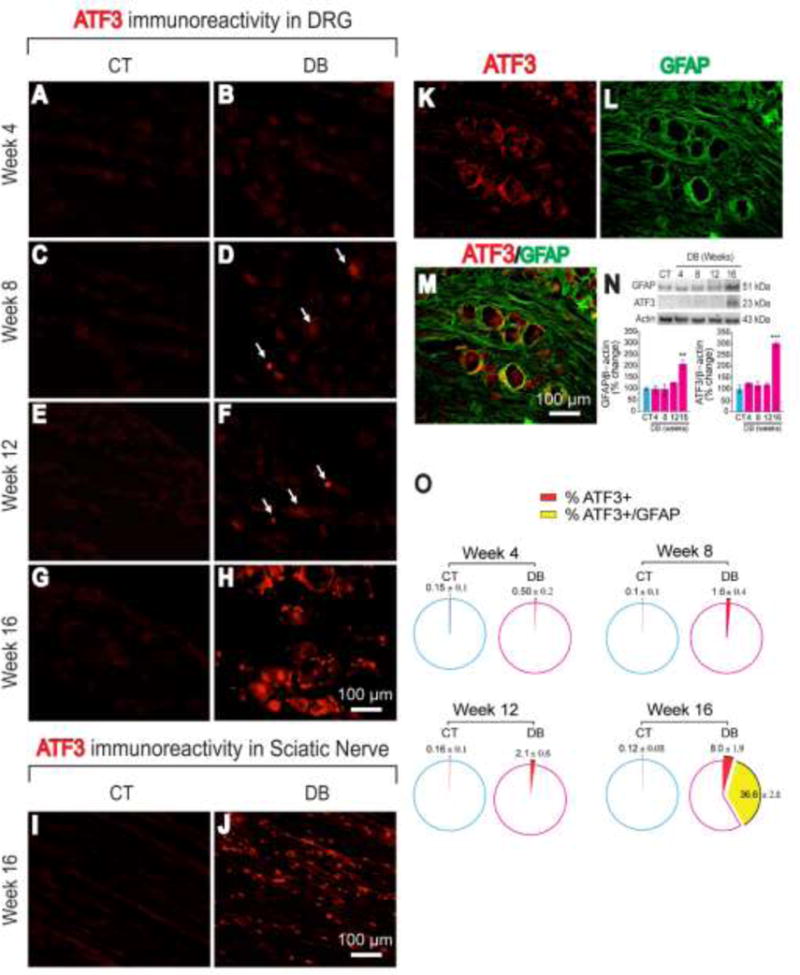
Figure 3.

Effects of the nSTZ on immunoreactivity and expression of ATF3 in lumbar DRG and sciatic nerve. (A-H) Representative images of ATF3 immunoreactivity in L4-L6 DRG from control (CT) and diabetic (DB) rats. (I-J) Representative images of ATF3 immunoreactivity in sciatic nerve in CT and DB rats at week 16. (K-M) representative images of ATF3 immunoreactivity co-localization with satellite glial cells (GFAP+) in L4-L6 DRG at week 16. (N) Time-course of ATF3 and GFAP expression in L4-L6 DRGs by western blot (n=4). (O) Quantification of ATF3-Immunoreactivity in L4-L6 DRG (5 slices from a group of 3 rats). **p < 0.01, ***p < 0.001 Significantly different from the control group (CT), as determined by one-way ANOVA followed by the Bonferroni test.
