
Figure 4. BKCa single‐channel voltage activation in UA SMCs from WT mice.
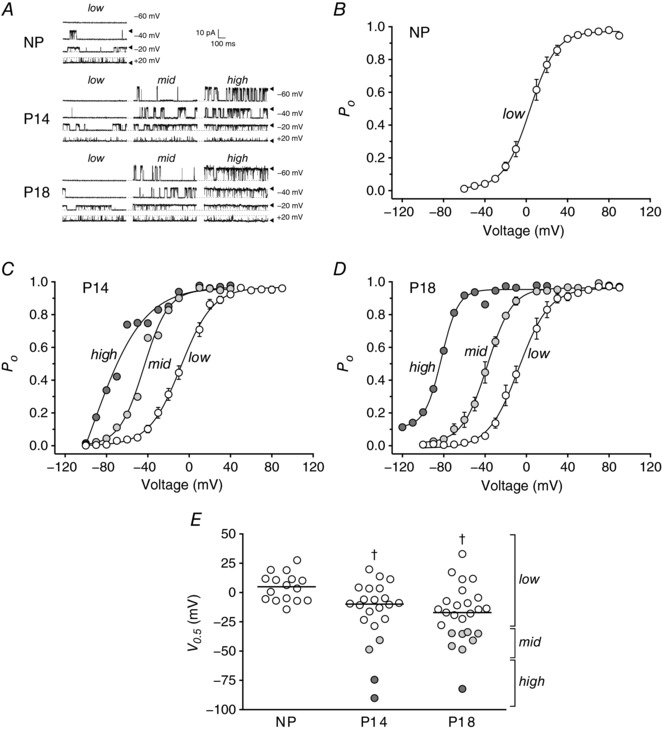
A, representative inside‐out patch‐clamp recordings from UA SMCs isolated from NP, P14 and P18 WT mice in the presence of 10 μm Ca2+ in the bath; membrane potential was held as indicated. Arrowheads and dashed lines indicate open and closed states of the channels, respectively. Single‐channel currents from NP, P14 and P18 showed different activation patterns (low, mid and high). B–D, voltage dependence of BKCa channel activation in UA SMCs isolated from NP (B), P14 (C) and P18 mice (D), expressed as open probability of the channel (P o), in the presence of 10 μm Ca2+. Single‐channel currents from NP, P14 and P18 showed different activation voltages, shown as different curves (low, mid and high; open, light grey and dark grey circles, respectively). Symbols are mean values ± SEM, except where n = 1 or 2. E, voltage of half‐maximal activation (V 0.5) obtained from voltage‐activation curves from NP (circles, N = 4 mice), P14 (squares, N = 9 mice) and P18 mice (triangles, N = 11 mice). Three sensitivities to voltage (low, mid and high) are depicted by open, light grey and dark grey circles, respectively. In P14, low sensitivity values were measured in 18 patches from 8 mice (mice 1, 2, 4, 5, 6, 7, 8, 9), mid sensitivity values were observed in 2 patches from 2 mice (mice 1 and 8) and high sensitivity values were measured in 2 patches from 2 mice (mice 1 and 3). In P18, low sensitivities were observed in 16 patches from 10 mice (mice 10, 11, 12, 13, 15, 16, 17, 18, 19, 20), mid sensitivity values were found in 7 patches from 6 mice (mice 14, 15, 16, 17, 18, 19) and high sensitivity was observed in 1 patch from 1 mouse (mouse 20). Symbols are individual patches; lines are median values. † P < 0.05 compared to NP.