
Figure 5. mRNA expression of BKCa and its auxiliary β1‐ and γ1‐subunits in UA during pregnancy.
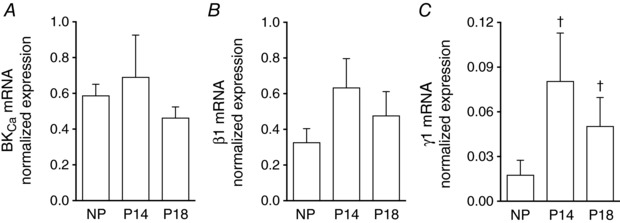
qPCR analysis of mRNA levels from BKCa α‐ (A, n = 6–10), β1‐ (B, n = 5–7) and γ1‐subunits (C, n = 6–8) in UAs isolated from NP, P14 and P18 WT mice. mRNA expression was normalized to expression of succinate dehydrogenase complex flavoprotein subunit A. Columns are mean values ± SEM. † P < 0.05 compared to NP.