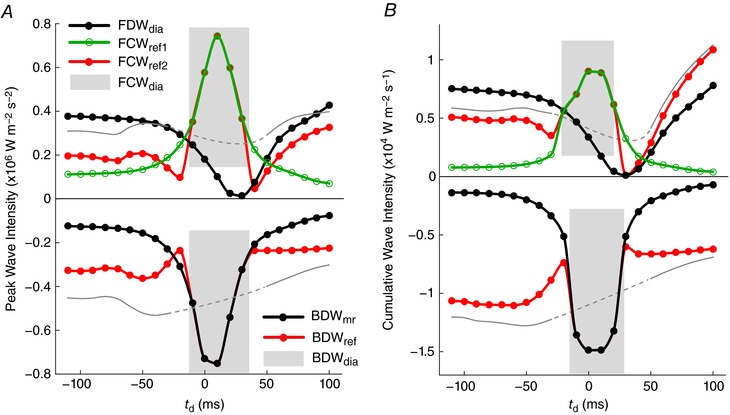
Figure 8. Peak intensity and cumulative intensity of forward and backward waves shown in Fig. 7 versus the delay time (t d).

Shaded areas indicated where two waves overlap and appear as a single wave peak. Thin grey lines indicate the linear sum FCWref1 + FCWref2 (top) or BDWmr + BDWref (bottom), while the dashed segments indicate an approximate interpolation; these may be compared with the observed wave magnitude, which results from non‐linear summation. Note that FDWA→C in Fig. 7 refers to FDWdia in the absence of interactions with reflected waves. [Color figure can be viewed at wileyonlinelibrary.com]
