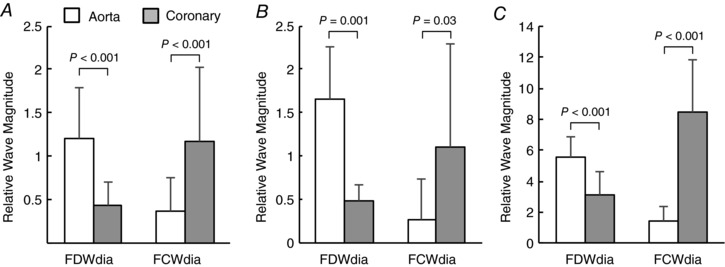
Figure 12. Comparison of early diastolic forward wave magnitude in the ascending aorta vs. the circumflex coronary artery at (A) baseline (all animals, n = 18), (B) after aortic constriction (n = 7) and (C) after administration of l‐NNA (n = 11, note the difference in y‐axis scale).

Peak wave intensities of FDWdia and FCWdia are expressed relative to that of FCWsys in the respective measurement location.
