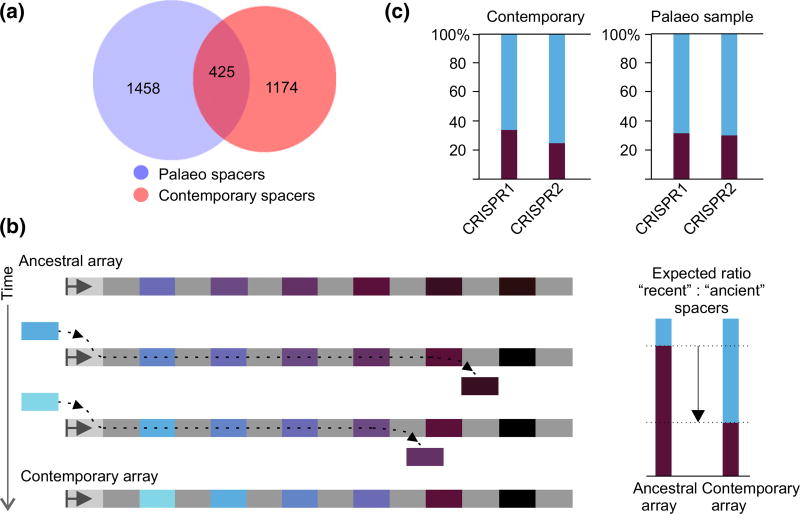
Fig. 2.
Comparison of ancient and present-day Escherichia coli type I-E CRISPR spacers. (a) Comparison of spacer cluster sets. Numbers within circles correspond to unique and overlapping spacer clusters. Blue circle represents clusters obtained from the mammoth sample; red circle represents known E. coli type I-E spacer cluster set. (b) An ancestral CRISPR array is schematically shown at the top. Repeats are light grey, and spacers are coloured. The leader (light grey rectangle with arrow) is shown on the left. With the passage of time, additional spacers (coloured with lighter shades of blue) are acquired at the leader-proximal end, while internal spacers (dark-coloured) are lost. A resulting contemporary array is shown at the bottom. Expected ratios of recently acquired (spacer-proximal) and ancient (spacer-distal) spacers in the ancestral and contemporary arrays are shown at the right. (c) The overall frequency of ‘ancient’ and ‘recent’ E. coli type I-E CRISPR spacer clusters from known CRISPR arrays present in public databases (DB) and in the mammoth sample is shown. Data for CRISPR1 and CRISPR2 arrays are shown separately.

