Figure 5.
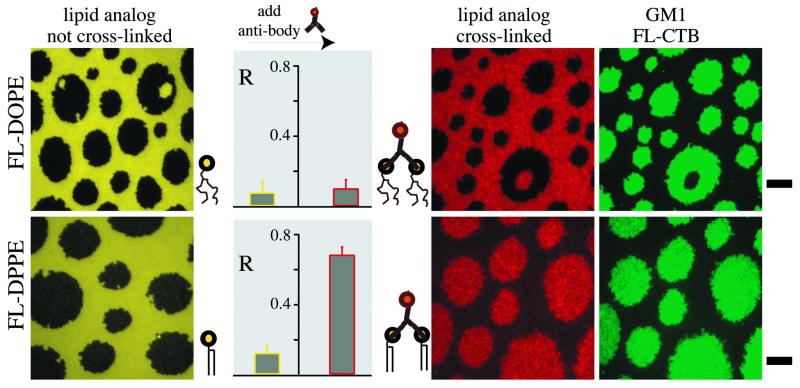
Effect of cross-linking on the distribution of fluorescent phospholipid analogs between the liquid-disordered and raft-like phases. Monolayers were prepared from DOPC/SM/cholesterol containing 1 mol% GM1 and 0.5 mol% FL-DOPE or 0.5 mol% FL-DPPE, and transferred onto silanized glass coverslips at 32 dyne/cm. Typical fluorescence micrographs are shown for monolayers containing (Upper) FL-DOPE and (Lower) FL-DPPE. The yellow images show the distributions of the fluorescent lipids as monitored by measuring fluorescein fluorescence in the green channel. The red images illustrate the distributions of complexes of fluorescent lipids and Alexa594-conjugated antifluorescein polyclonal antibodies as determined by measuring Alexa594 fluorescence in the red channel. The green images show the corresponding distribution of GM1 as indicated by measuring the fluorescence in the green channel for monolayers after treatment with antibodies and then FL-CTB. To achieve accurate representations of FL-CTB densities, the offsets in the green panels were determined as the average intensities measured in the green channel before FL-CTB binding. The plots depict the relative partitioning, R, into the raft-like phase for fluorescent lipid analogs before and after cross-linking with antibodies before FL-CTB incubation. T = 24°C. (Bars are 5 μm.)

