Fig. 2.
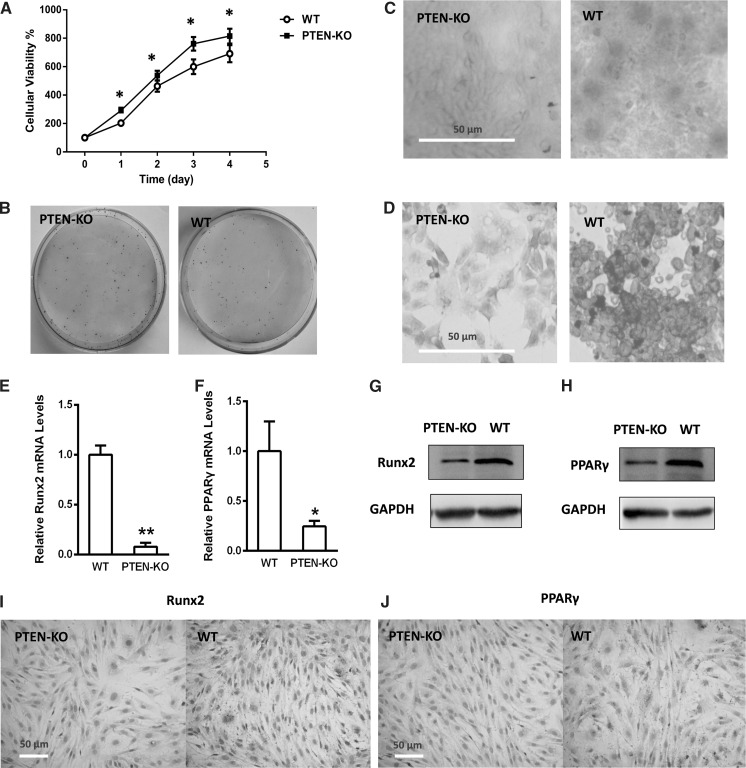
PTEN-KO BMSCs have an increased proliferation and decreased multipotent capability. a CCK-8 assay indicated an increased viable cell number compared to the WT (day 0 = 100% for each group). b Colony formation assay. The identical seeding number of PTEN-KO cells formed much more clonies than WT. c Alizarin red staining. d Oil red staining. e PTEN-KO BMSCs showed a decreased Runx2 mRNA level (normalized by the WT level). f PTEN-KO BMSCs showed a decreased PPARγ mRNA level (normalized by the WT level). g PTEN-KO BMSCs showed a decreased Runx2 protein level assessed by Western blot. h PTEN-KO BMSCs showed a decreased PPARγ protein level assessed by Western blot. i PTEN-KO BMSCs showed a decreased Runx2 protein level assessed by immunochemistry. j PTEN-KO BMSCs showed a decreased PPARγ protein level assessed by immunochemistry. *P < 0.05 versus WT, **P < 0.01 versus WT

