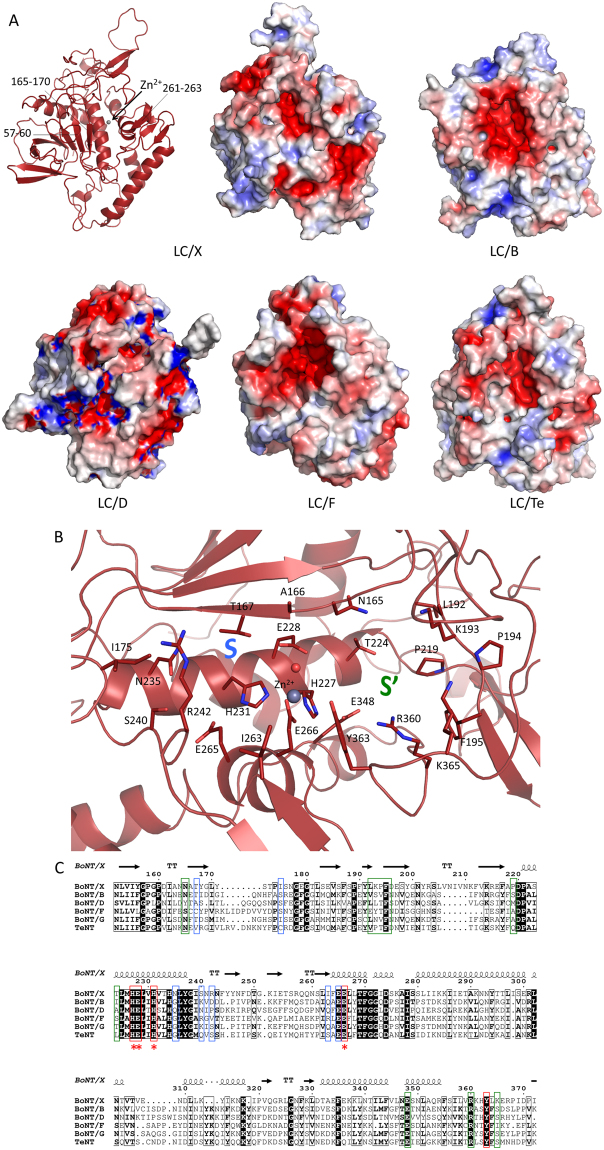
Figure 4.
Surface potential and catalytic cleft of LC/X. (A) Left, ribbon representation of LC/X; right, surface representation of LC/X, /B, /D, /F and /Te with electrostatic potential calculated using the APBS tool in PyMol. (B) The substrate binding sites of LC/X highlighting the S an S’ sub-pockets. (C) Sequence alignment of LC/X with other VAMP-cleaving toxins. Catalytic site residues are framed in red, residues of the S an S’ sub-pockets are framed in blue and green, respectively. Stars denote amino acids involved in Zn2+ coordination.

