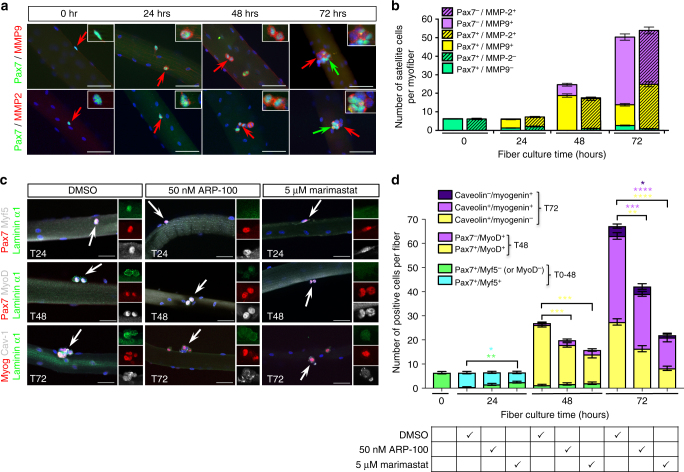
Fig. 3.
MMP2 and MMP9 catalyze SC basal lamina remodeling. a Immuno-localization of MMP2 and MMP9 (red) in EDL myofibers cultured for 72 h. Inserts are high magnification of satellite cells indicated by red arrows. Green arrows indicate Pax7+ satellite cells that are likely to be self-renewing cells and are negative for MMP2 and MMP9. Scale bar, 50 μm. b Quantification of the number of SCs expressing MMP2 and MMP9 in cultured EDL myofibers. The color code used relates to the cell populations described in Fig. 1b. n = 5 experiments with 50 myofibers per time point. c Representative images of control (DMSO) or treated myofibers cultured in the presence of the MMP inhibitors ARP-100 and Marimastat. Arrows indicate SCs shown at high magnification in inserts. Note the reduced deposition of laminin α1 after 24 h and 48 h in the presence of ARP-100 and the complete absence of laminin α1 after 24 h and 48 h in the presence of Marimastat. Scale bar, 50 μm. d Quantification of the effect of MMP inhibition by ARP-100 and Marismastat on the progression of SCs through the myogenic program in the ex-vivo myofiber culture system. n = 3 experiments with 25–40 fibers per time point. Graphs show mean + sem. *P < 0.05, **P < 0.01, ***P < 0.001, ****P < 0.0001 (t-test)

