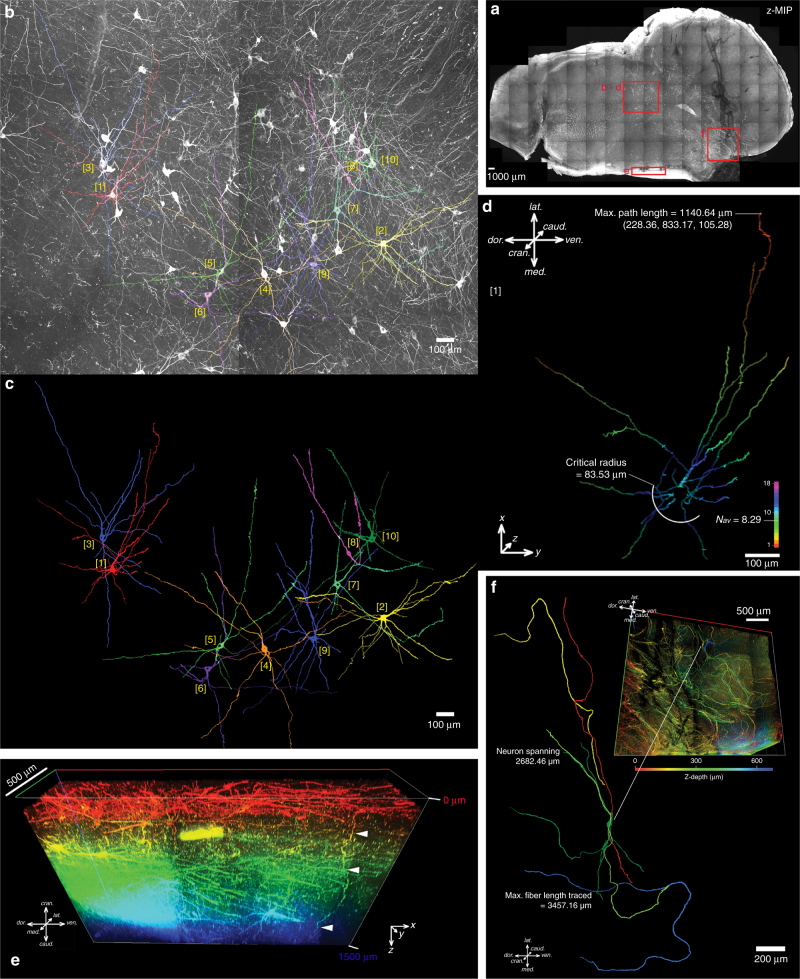
Fig. 4.
3D mapping of the brainstem catecholaminergic system. a. A maximum projection image of a 21.6 mm-wide, 12.2 mm-tall, 1.5 mm-thick slice of midbrain immunostained for tyrosine hydroxylase (TH) with an imaging depth of 1748.36 µm. Zoomed images showing detailed morphology of TH-immunopositive neurons. Highlighted areas are presented with analyses in subsequent subpanels. b–d Reticular formation pictured in a, b maximum projection image with 10 neurons traced and segmented, which are presented in c, based on which Sholl analysis has been performed and the results for neuron [1] shown in d. The results for other neurons is presented in Supplementary Figure 14. The cartesian coordinates (in µm) were labelled for the longest path length with the soma marked as the origin. The number of intersections was colour-coded. Nav is the average number of intersections of the entire arborisation, and is computed by dividing the area under the fitted polynomial function by the maximal radial extent of the neuronal fibres. The critical radius is radial distance from soma where the maximum number of intersections occurs. e The medial border of the sample in the anatomical location of caudal linear nucleus, where the antibody penetration was adequate for image throughout the thickness of the sample. This is exemplified by a fibre (highlighted by arrowheads) travelling caudocranially along the Z-direction. Z-depth colour-coded 3D rendering, scale bar on the left upper corner is 500 µm. f A Z-depth colour-coded 3D rendering of the substantia nigra reticulata demonstrating curliform TH-positive fibres as they are being separated by the descending tracts from the cortex. Some of these has been traced demonstrating fibre lengths and neuronal span up to 3457 µm and 2682 µm, respectively

