Fig. 5.
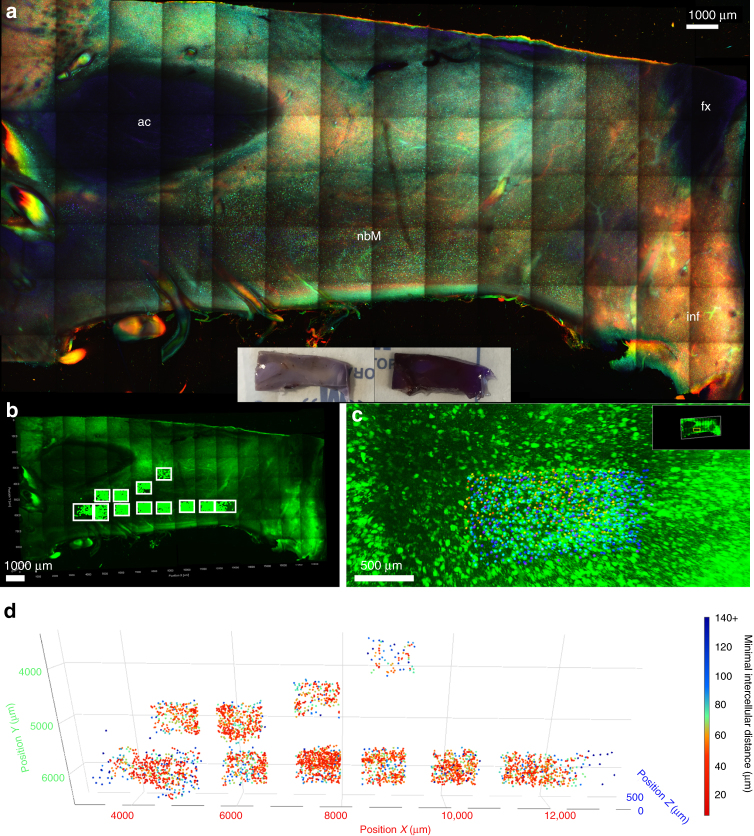
3D visualisation and quantification of basal forebrain magnocellular neurons. a Three-dimensional cresyl violet staining for the visualisation of the nucleus basalis of Meynert (nbM) on a 10.8 mm-wide, 5.5 mm-tall, 2.5 mm-thick basal forebrain block (imaging Z-depth = 1120.00 µm). Tissue block was delipidated with SDS for 3 days and stained with cresyl violet for 3 days (gross appearance shown in inset). Image on bottom left showed magnified view of selected areas from top image. Z-positions of the quantified and annotated neurons were colour-coded according to the reference bars, where the numerical values indicate the distances from the imaging objective for each end of the spectrum (bottom right). b–d Quantification of magnocellular neurons in region of interests highlighted in b (white boxes), where the coordinates of each neuron were marked and annotated (c). d 4D scatter plot of all 3528 neurons, the distance of each neuron to its nearest neighbour was calculated and represented with colour coding. More detailed statistics were provided in Supplementary Figure 15. ac anterior commissure, fx fornix, inf infundibulum, nbM nucleus basalis of Meynert

