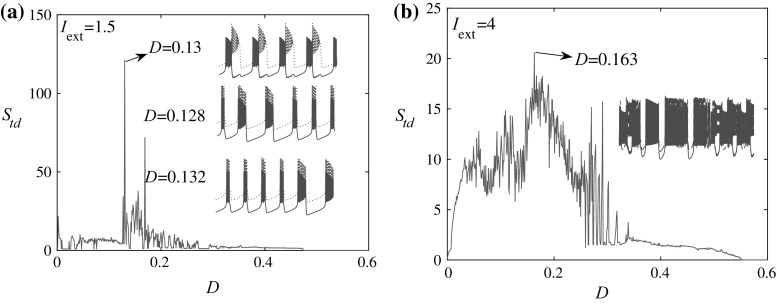
Fig. 4.
Spike timing distance versus coupling strength. a For I ext = 1.5. The insets are time series of x 1 (dotted green) and x 2 (solid red) for different coupling strengths. The time series are shifted for a better illustration. b For I ext = 4. The time window for calculating S td is [100,000, 180,000], and the initial conditions are {0.1, 0, 0} for one neuron and {0.2, 0, 0} for the other

