Figure 6.
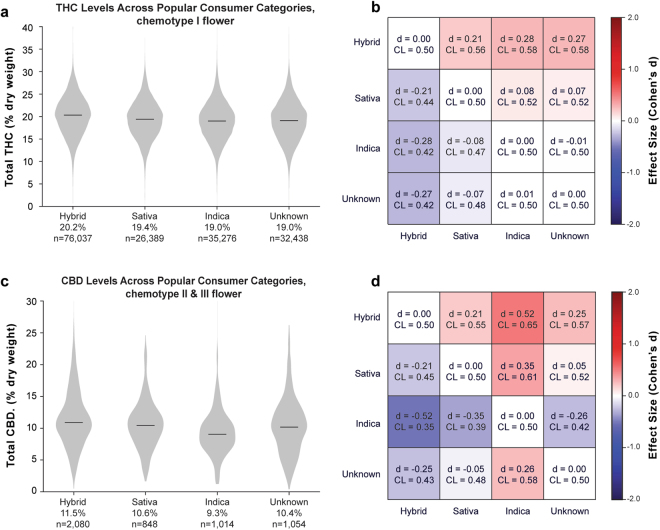
Total THC and CBD Levels Across Popular Consumer Strain Categories for Flower Products. (a) Distribution of THC levels across popular strain categories for chemotype I flower and (b) effect size matrix quantifying the magnitude of differences between them. (c) Distribution of CBD levels across the same categories for chemotype II and III flower and (d) effect size matrix quantifying the magnitude of differences between them.

