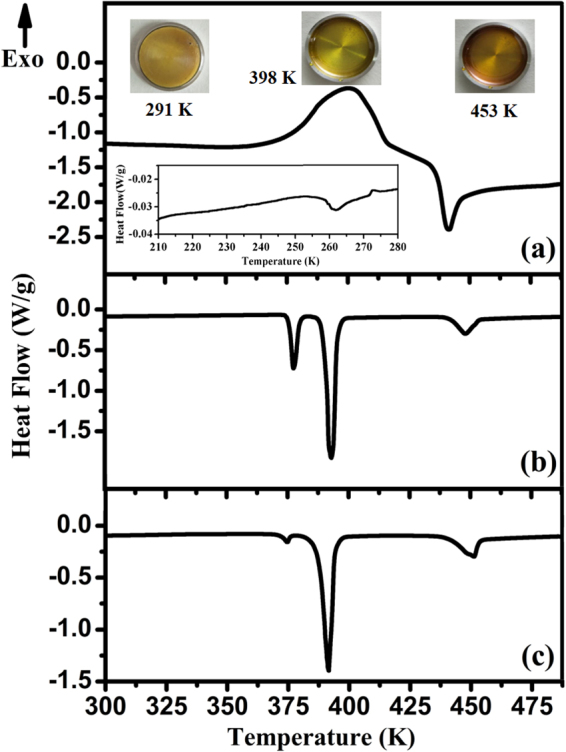
Figure 1.

The DSC curves during the 10 K/min heating experiments of (a) amorphous sulfur in this work; (b) crystal sulfur; (c) quenched amorphous sulfur. The inset heat flow curve in Fig. 1(a) is the DSC curve of amorphous sulfur in range of 210–280 K. The inset photos in Fig. 1(a) are the pictures of amorphous sulfur at 291 K, 398 K, and 453 K, which show the changes of sample color, i.e., from dark yellow to light yellow then to dark yellow.
