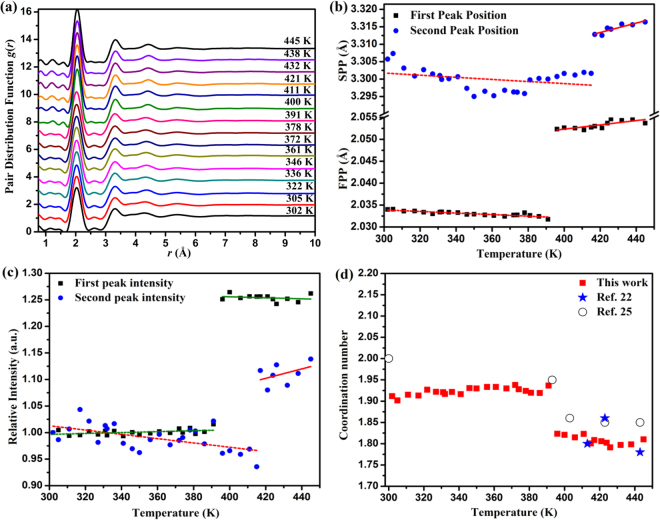
Figure 4.
Structural evolution of amorphous sulfur in real space. (a) Pair distribution function g(r) at selected temperatures; (b) The position of the first and second peak of g(r) at a temperature range 302 K to 445 K; (c) The peak intensity of the first and second peak in g(r) as a function of temperature. The position and intensity in the g(r) peak were obtained by a Gaussian fitting; (d) Coordination numbers in the first nearest-neighbor shell of amorphous sulfur at different temperatures. Data of crystal sulfur from ref.22 and ref.25 are shown for comparison.

