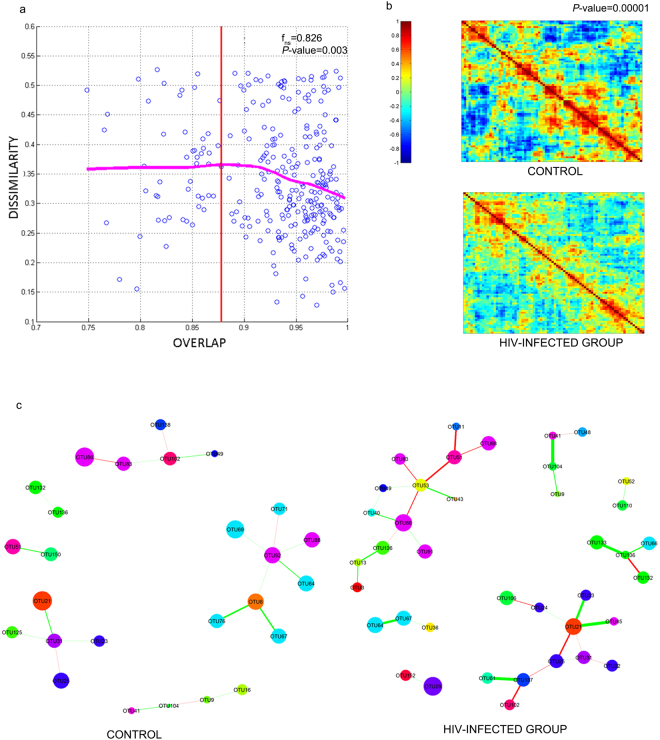
Figure 1.
Network structure of the microbial communities found in HIV-infected and control individuals. (a) The fecal microbiota of HIV-infected individuals follows a pattern of universality as described by Bashan et al.32. Each point represents the comparisons between the samples of two individuals. The fraction of shared bacteria (overlap) is plotted against the dissimilarity index, which was evaluated based on the square root of the Jensen–Shannon divergence. The dissimilarity index calculates the distance between pairs of individuals in terms of abundance of shared species. The dissimilarity-overlap curve (DOC) is represented by a pink curve and was calculated using the robust LOWESS method. The fraction of points beyond the inflection point (OC) of the DOC curve – the point at which the curve shows a negative slope - was calculated by: . The P-values are finally calculated as the fraction of bootstrap runs resulting with non-negative slopes. (b) Heat map of Pearson Correlation of HIV-infected individuals and non-infected control group. We performed a Jennrich test to calculate the p-value associated to the correlation structures between HIV-infected patients control group. (c) Differences in the microbial networks of fecal samples obtained from HIV-infected and control individuals. Using the SPIEC-EASI MB method, networks were constructed from the table of clr-transformed OTUs.

