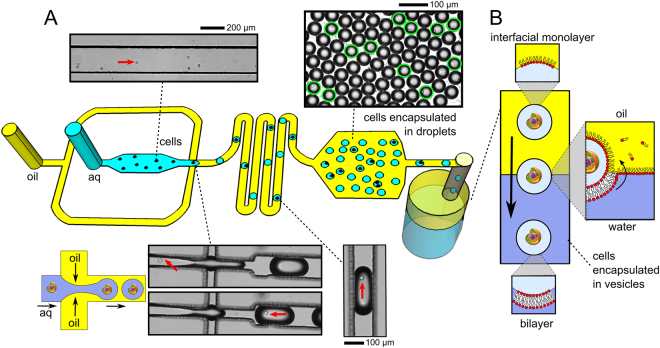
Figure 2.
Schematic and microscopy images of the generation of cells-in-vesicles. (A) A microfluidic chip was used to encapsulate cells in w/o droplets encased in a lipid monolayer. An aqueous phase containing cells was passed through a flow-focusing junction where it met an oil phase containing lipids, leading to droplet generation. Red arrows show the position of a cell before and after encapsulation. Ratio of cell to droplet size varied from 1:4 to 1:10 depending on the cell type, junction geometry, and flow rates. Droplets were then collected in a chamber where their size and encapsulation number was analysed. A mixture of empty droplets and those containing cells (green circles) were observed. Droplets were then expelled from the device to an emulsion phase transfer column. (B) Schematic depicting the transformation of cells-in-droplets to cells-in-vesicles. The droplets descended through the column under gravity. As droplets transferred into the aqueous phase the interfacial monolayer wrapped around them, transforming them into vesicles with cells encapsulated inside.

