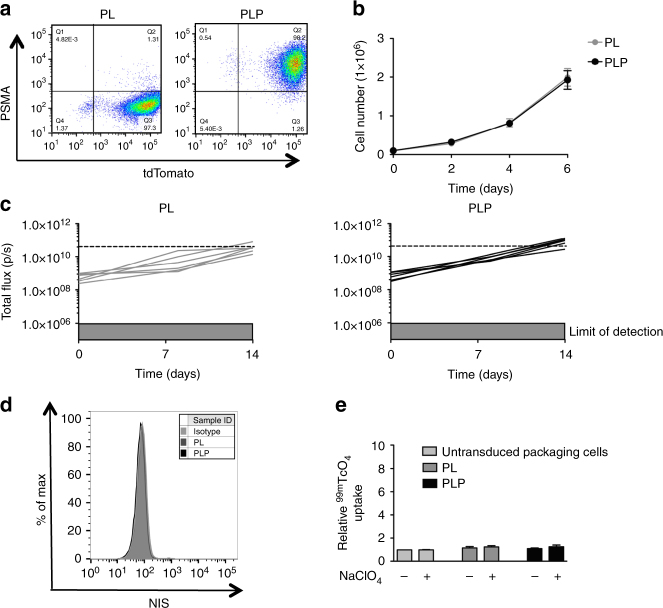
Fig. 1.
Establishing a PSMA+/− xenograft model. a Representative flow cytometry pseudo-color density plot of PL and PLP tumor cells to assess PSMA and tdTomato expression. b In vitro growth of PL and PLP tumor cells. c In vivo growth of PL and PLP subcutaneous tumor xenografts was assessed using bioluminescence imaging. Differences were not statistically significant. d Representative flow cytometry histograms of PL and PLP tumor cells to detect hNIS expression on the cell surface. e Relative in vitro uptake levels of PL and PLP tumor cells treated with 0.1 MBq 99mTcO4− in the presence or absence of 10 mM NaClO4−. Empty RD packaging cells were used as a control. All graphs presents mean ± s.e.m. of three independent experiments

