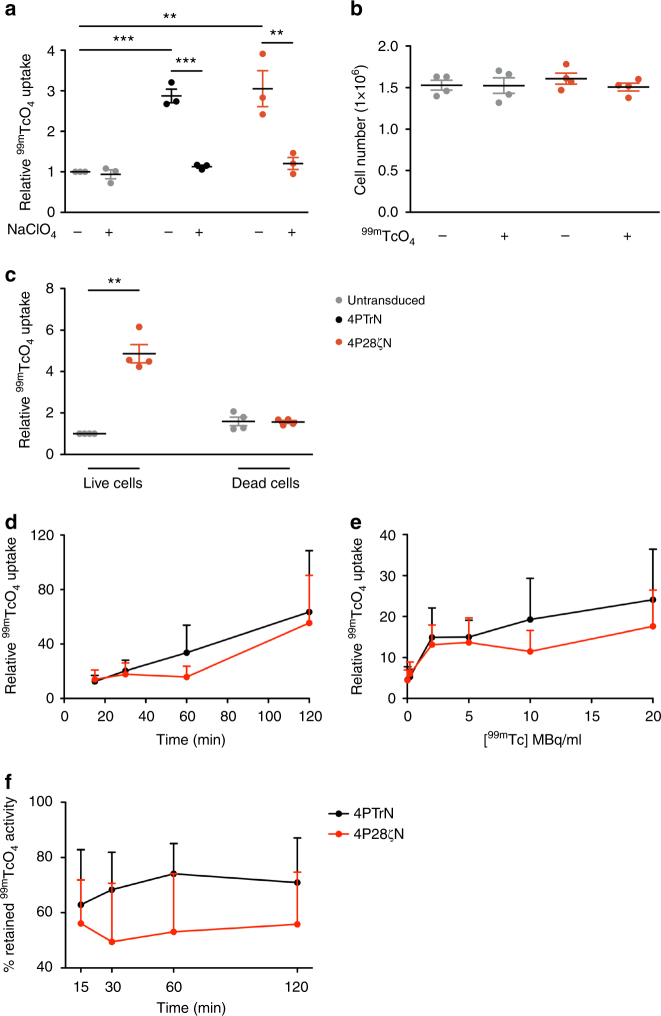
Fig. 3.
Establishing and validating hNIS function. a Relative in vitro uptake levels of T cells treated with 99mTcO4− in the presence or absence of NaClO4−. n = 3 donors/group. b Cell counts of untransduced or 4P28ζN T cells after 24 h culture in the presence or absence of 99mTcO4−. n = 4 donors/group. Graph presents mean ± s.e.m. c Relative in vitro uptake levels in live/dead untransduced or 4P28ζN T cells treated with 99mTcO4−. n = 4 donors/group. Graphs present mean ± s.e.m. *P < 0.05, **P < 0.01, ***P < 0.001. d Relative T-cell 99mTcO4− uptake over time. n = 6 donors/group. Graphs present mean + s.e.m. e Relative uptake of 99mTcO4− by concentration. n = 6 donors/group. Graphs present mean + s.e.m. f Efflux of 99mTcO4− over time shown as % of retained activity normalized to time 0. n = 3 donors/group. Graphs present mean + s.e.m.

