Fig. 6.
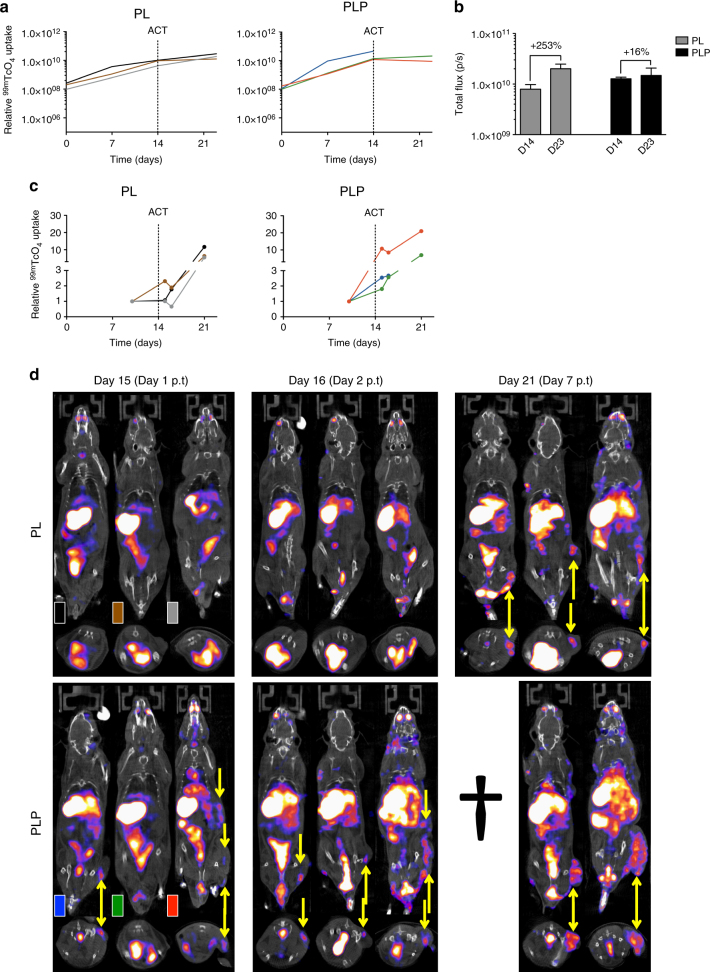
In a ‘high tumor burden’ model, SPECT-CT imaging shows rapid 4P28ζN T-cell accumulation within the tumor mass. a Burden of subcutaneous firefly luciferase-expressing PL and PLP tumors was assessed by BLI over a period of 21 days. n = 3 animals/group. Graphs present individual animal BLI signals. b Tumor growth at day 14 and day 23 as assessed by BLI. n = 3 animals/group. Graph presents mean + s.e.m. c 99mTcO4− activity in the tumor was quantified through 3D ROI analysis and normalized to baseline. n = 3 animals/group. Graphs present individual animal SPECT signals. d SPECT-CT images depicting the accumulation of NIS-expressing T cells in the tumors (indicated by the yellow arrows) of the individual animals (p.t = post-therapy; † = dead animal)

