Figure 7.
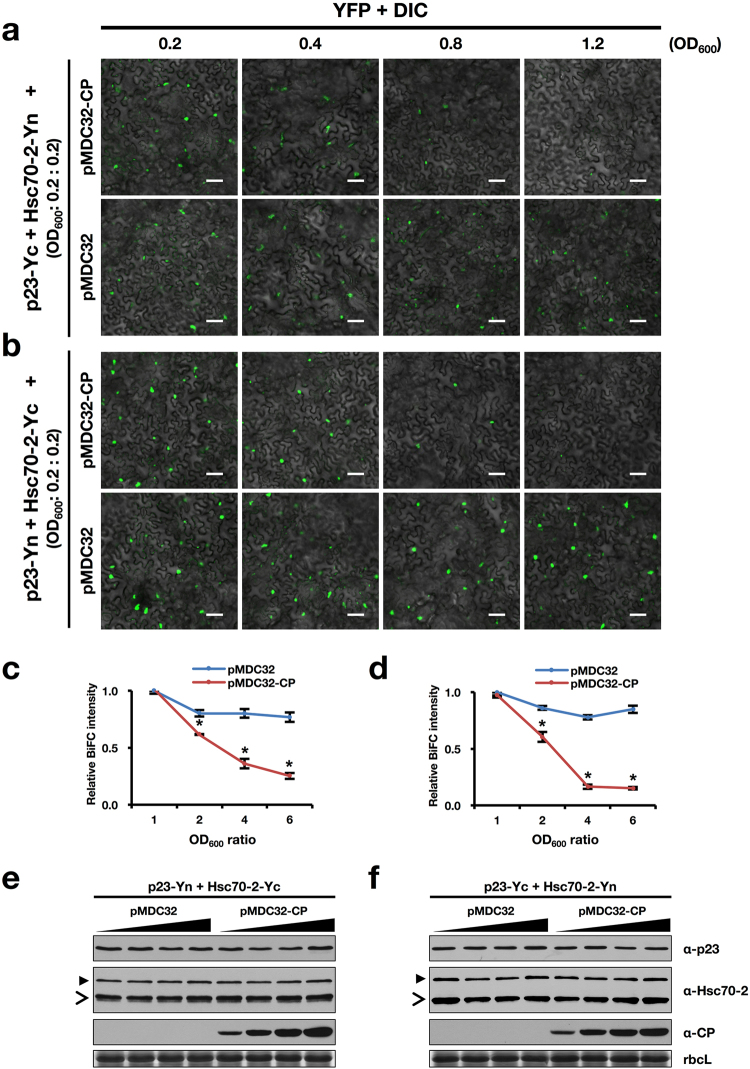
BBSV CP interferes with the interactions between Hsc70-2 and p23 in a dose-dependent manner. (a,b) Competitive BiFC analysis of the effect of CP on the interactions between Hsc70-2 and p23. Different combinations of constructs used for agroinfiltration are indicated on the left. Scale bars, 50 μm. Concentrations of Agrobacterium cells carrying pMDC32 or pMDC32-CP were indicated above the panels. (c,d) Graphical representation of the relative BiFC intensity as shown in (a) and (b). YFP fluorescence for each panel was measured using Image J software (NIH), and relative BiFC intensity was diagramed by normalizing the fluorescence intensity of each combination to that of the pMDC32-CP or pMDC32 with the lowest concentration (OD600 = 0.2). The y-axis shows the relative BiFC intensity, the x-axis indicates the ratio of different concentrations of Agrobacterium cells relative to that of OD600 = 0.2. Error bars represent standard deviation from the mean (n = 3). Asterisk indicates statistically significant difference between pMDC32 and pMDC32-CP groups under the same OD600 ratio (Student’s t-test, *P < 0.05). (e,f) Western blot analysis of total protein extracts from agroinfiltrated leaves corresponding to (a) and (b). The open arrowheads point to the bands of endogenous Hsc70-2, whereas solid arrowheads indicate the split YFP-fused Hsc70-2. CBB staining of rbcL is shown as the loading control.

