Figure 1.
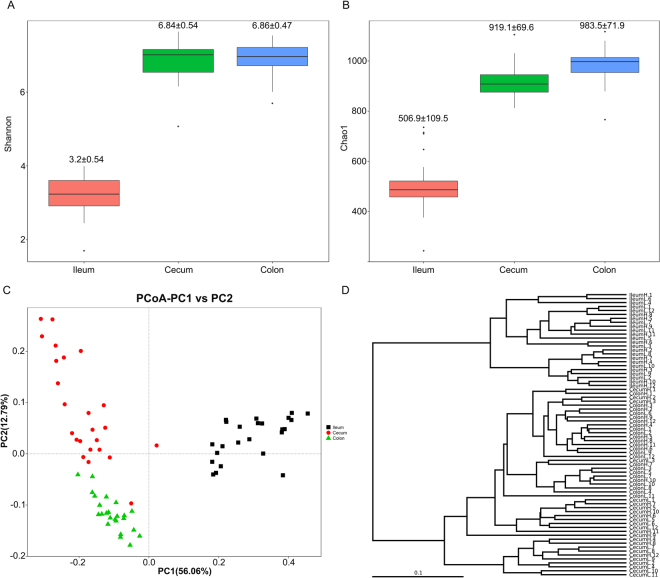
The alpha- and beta- diversity comparisons for the ileum, cecum, and colon. (A) The Shannon’s diversity index at the sampling site (mean ± SD). (B) The Chao1 index at the sampling site (mean ± SD). (C) Weighted UniFrac PCoA of the microbiota. Each symbol and color represents each gut location microbiota. (D) Bray Curtis dendrogram analyses were performed on the 16S rRNA V4–V5 region data. Samples are coded to represent the sampling site (Ileum; Cecum; Colon) and feed conversion ratio status (H, high feed conversion ratio; L, low feed conversion ratio). For example, IleumH represented a sample that was collected from the ileum of a high FCR pig.

