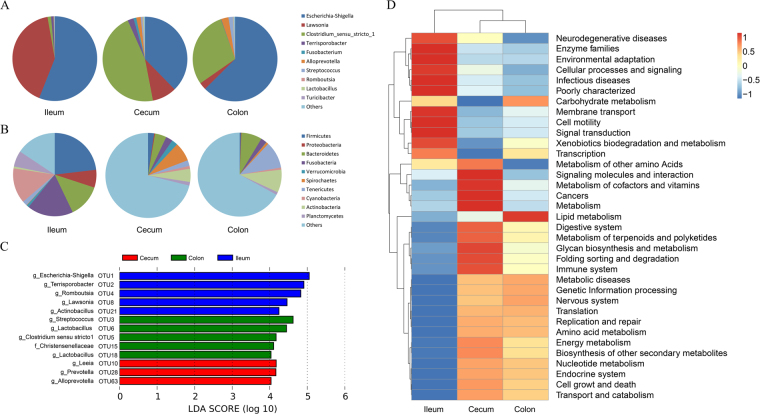
Figure 2.
Relative abundance analyses at the OTU level and functional capacity profiles of the microbial communities of the ileum, cecum, and colon derived from 16S rRNA gene sequencing data. (A) Microbial composition at the phylum level. (B) Microbial composition at the genus level. Gut locations are represented along the horizontal axis, and relative abundance is denoted by the pie charts. (C) LEfSe identified significantly different OTUs according to the relative abundance among the three gut locations. The histogram shows the LDA scores computed for features at the OTU level, and each OTU was annotated at the lowest classification level (p: phylum, c: class, o: order, f: family, g: genus) according to the GreenGenes Database. OTUs in this graph were statistically significant (P < 0.05) and had an LDA Score >±4.0, which was considered a significant effect size. (D) Predicted function of the gut microbiota in the ileum, cecum, and colon. The vertical columns represent groups, and the horizontal rows depict metabolic pathways. The color coding is based on row z-scores.

