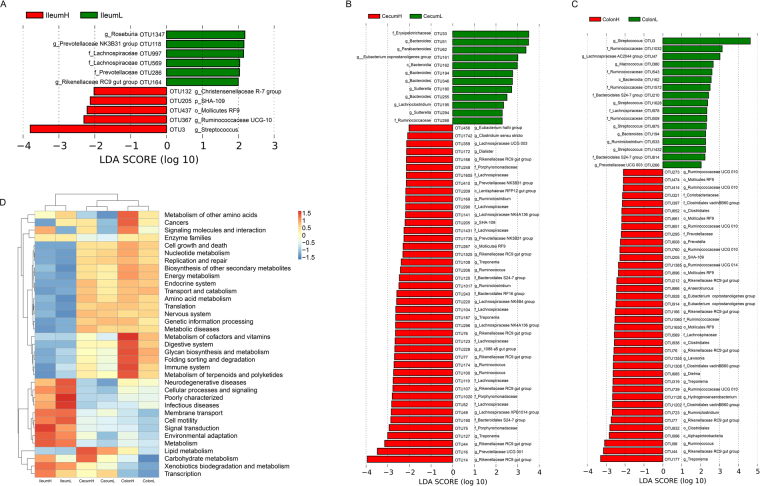
Figure 4.
Taxonomic and functional capacity profiles of the microbial communities of high and low FCR groups in each gut location. LEfSe identified significantly different bacterial taxa (at OTU level) between the high and low FCR groups in the ileum (A), cecum (B), and colon (C). OTUs in this graph were statistically significant (P < 0.05) and had an LDA Score >±2.0, which was considered a significant effect size. (D) Predicted function of the gut microbiota between high and low FCR groups at each gut location.

