Fig. 6.
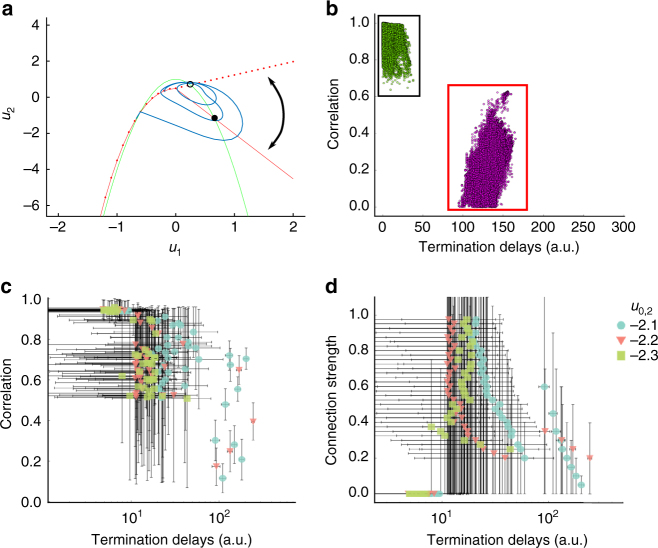
Synchronized seizure termination results from the fast propagation of ictal SWDs. a Phase space for the fast population (u1 and u2) of the Epileptor field model at seizure offset. The slope of the straight part of the red nullcline changes when a SWD occurs, transforming the stable fixed point (black dot) into an unstable fixed point (black circle) and allowing for fast oscillations to emerge (blue trajectory) and cross the separatrix via a homoclinic bifurcation. The homoclinic bifurcation results in the termination of the seizure. The curved arrow represents the change in the nullcline before and after a SWD. b Pairwise correlations between different sites in the neural field model as a function of seizure termination delays. Same seizure simulation as in Fig. 2, except that noise was added (see Methods). Black (red) rectangle: pairwise correlation for spatial locations in the same (different) Epileptor field model. Lower correlation values are obtained when the pairwise sites are in different fields (red rectangle). Green and violet dots indicate different clusters obtained via automated clustering (Methods) of the termination delays. c Mean pairwise correlation between different sites in the Epileptor field model as a function of termination delays for different values of the excitability (u0,2) of the second field and of the heterogeneous coupling strength (γhet,2). Each point corresponds to the mean for each one of the clusters obtained as in b. Each color/symbol indicates a different excitability value. The vertical and horizontal bars indicate the standard deviations in the corresponding coordinates. Note the log scale in the x-axis. d Same conventions as in c, except by showing instead mean pairwise connection strengths

