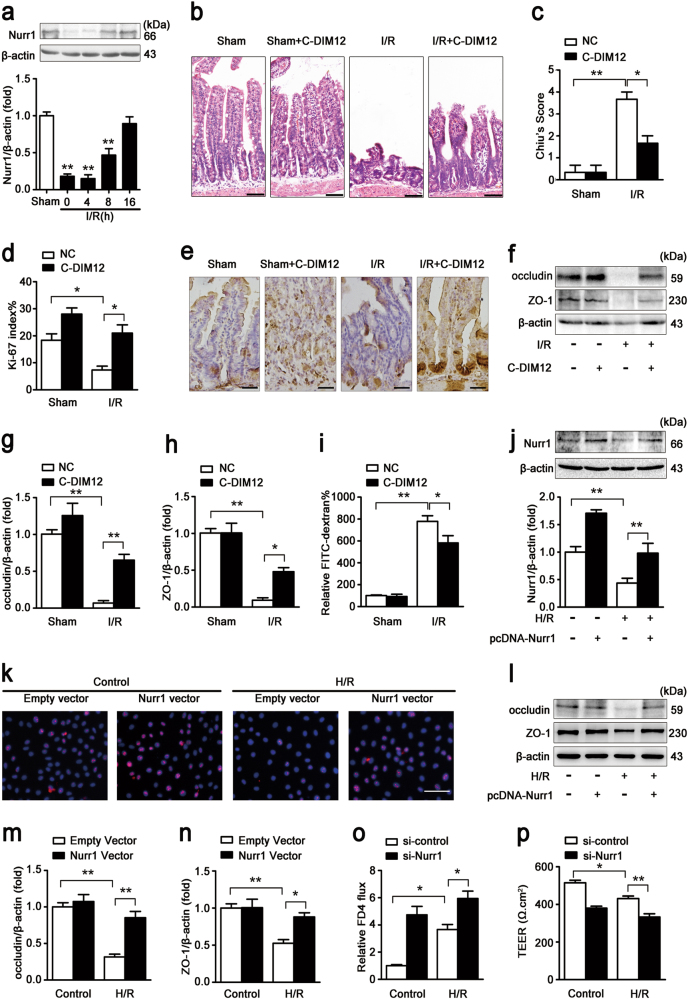
Fig. 1. Nurr1 regulates intestinal restoration after I/R injury.
a Mice were subjected to 45 min of intestinal ischemia followed by 0–16 h of reperfusion or sham surgery. I, ischemia; R, reperfusion; representative western blot showing nurr1 protein expression in the intestinal tissue lysates (n = 3 per group, **P < 0.01 versus sham group). b-i The mice were divided into the following four groups: a sham group, a sham + C-DIM12 group, an I/R group, and an I/R + C-DIM12 group (n = 8 per group). C-DIM12 (50 mg/kg) was orally gavaged at 4 h before surgery. The I/R times were 45/240 min, respectively. b and c Representative images of H&E-stained intestinal sections of mice from the above four groups. Intestinal injury was scored histopathologically (Chiu’s score) according to a scoring system. Scale bar = 100 μm. d and e Immunohistochemical staining for the Ki-67 antibody in intestinal tissues for proliferation analysis. Scale bar = 50 μm. f-h Representative western blot showing occludin and ZO-1 protein expression in the intestinal tissue lysates, n = 3 per group. i FITC-dextran intestinal epithelial paracellular permeability. j-n IEC-6 cells were transfected with plasmids encoding Nurr1 for 36 h and then incubated in hypoxic conditions for 6 h before being incubated in normoxic conditions for 6 h. j Representative western blot showing nurr1 protein expression, n = 3. k Immunofluorescence staining for the Ki-67 antibody in IEC-6 cells for proliferation analysis. Scale bar = 100 μm, n = 6. l-n Representative western blot showing occludin and ZO-1 protein expression, n = 3. o and p Caco-2 cells were infected with si-Nurr1 or its negative control (si-control) for 36 h and then exposed to hypoxic conditions for 12 h before being exposed to normoxic conditions 6 h. o Si-nurr1-induced changes in intestinal epithelial permeability, as measured by FITC-dextran permeability, n = 3. p The effect of si-Nurr1 on intestinal epithelial integrity was evaluated by TEER, n = 3. Data are representative of three independent experiments. *P < 0.05, **P < 0.01. The error bars describe the standard deviation

