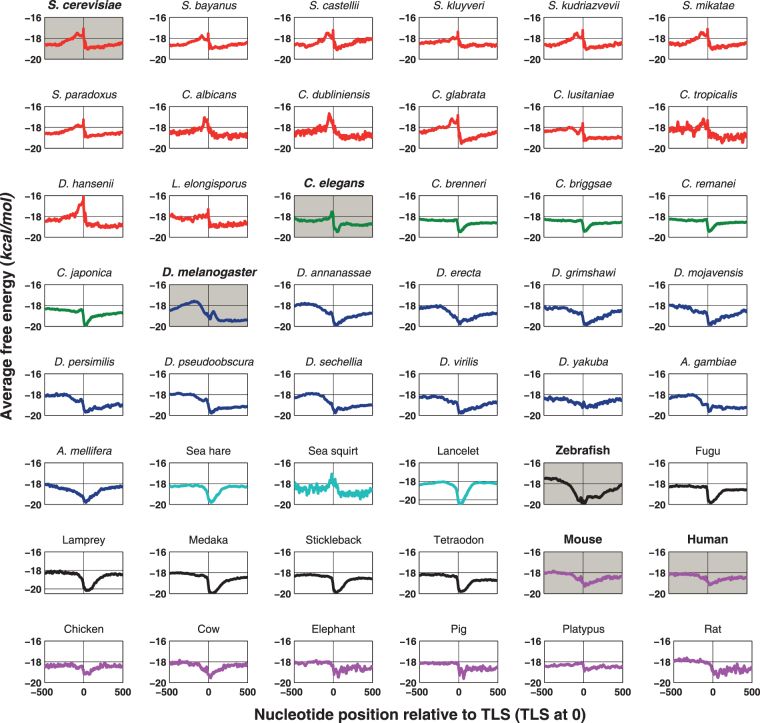
Figure 2.
Average free energy profiles of promoters regions in different eukaryotes belonging to fungi, invertebrates (worm and fly) and vertebrates. The promoter sequences (−500 to +500 relative to translation start site (TLS)) are downloaded from SGD, CGD, and UCSC genome browser. The promoter sequences with GC percentage range 40–45 have been plotted. The red, green, blue, cyan, black and pink color plots represent fungi, worm, fly, marine invertebrate, fish and mammal including bird respectively. The model systems S. cerevisiae, C. elegans, D. melanogaster, zebrafish, mouse, and human are highlighted with gray background. The trends in AFE profiles are unique to closely related classes.

