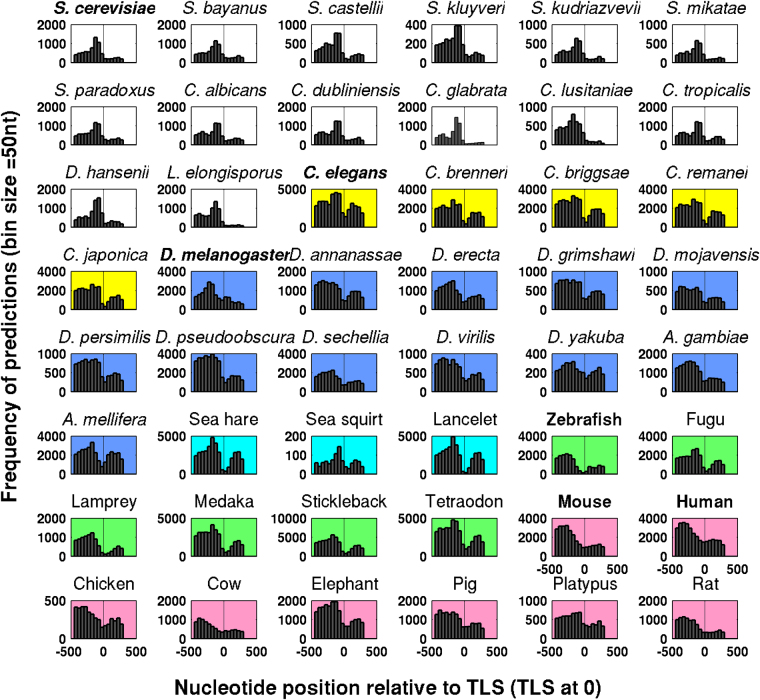
Figure 3.
Positional distribution of predictions in promoter regions of different eukaryotes. The plot shows the distance of predictions from TLS in 50 nt bins for 48 different eukaryotes representing 14 species of yeast, five species of worm, 12 species of fly, three marine invertebrates, six fish species, seven mammals, and chicken. Color codes for the background of subplots (white for fungi, yellow for the worm, blue for fly, cyan for marine invertebrates, green for fishes and pink for mammals and bird) have been used to differentiate between different domains of life.

