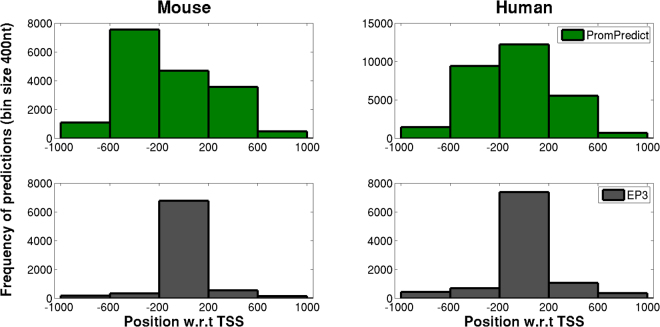
Figure 5.
Distribution of ‘TP’ promoter predictions by PromPredict and EP3. Predictions in −1000 to +1000 region relative to TSS for both mouse and human have been considered. PromPredict uses a 250 nt sliding window with the midpoint of a 100 nt window being considered as a prediction, if it satisfies GC based cut-offs, while EP3 prediction is given in a 400 nt non-overlapping window and defines the window as a true or false prediction based on genome-specific thresholds. In case more than one ‘TP’ prediction is obtained for a gene, then the position closest to TSS has been considered. Hence, the total number of TPs plotted corresponds to ‘TP genes’.

