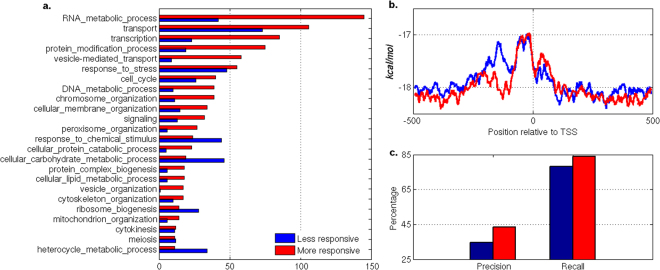
Figure 6.
Performance of PromPredict in less responsive and more responsive genes. Top and bottom ten percentile list of gene (or) promoter sequences considered for this analysis. The dataset contains 459 genes in each category. (a) The frequency of genes in each class of biological process has been plotted to compare the two classes of genes. The less responsive genes are overrepresented in few biological processes compared to more responsive genes. The genes categorized in the gene ontology GO SLIM categories were retrieved from Saccharomyces genome database (http://www.yeastgenome.org/). (b) AFE profiles plotted using 15 nt window shows the differences in the distribution of low stability regions for two classes of gene promoters. (c) Precision and recall values shown as bar plot suggest that PromPredict comparatively a better predictor for more responsive genes. The −500 to +100 region relative to TSS is considered as true positive region.

