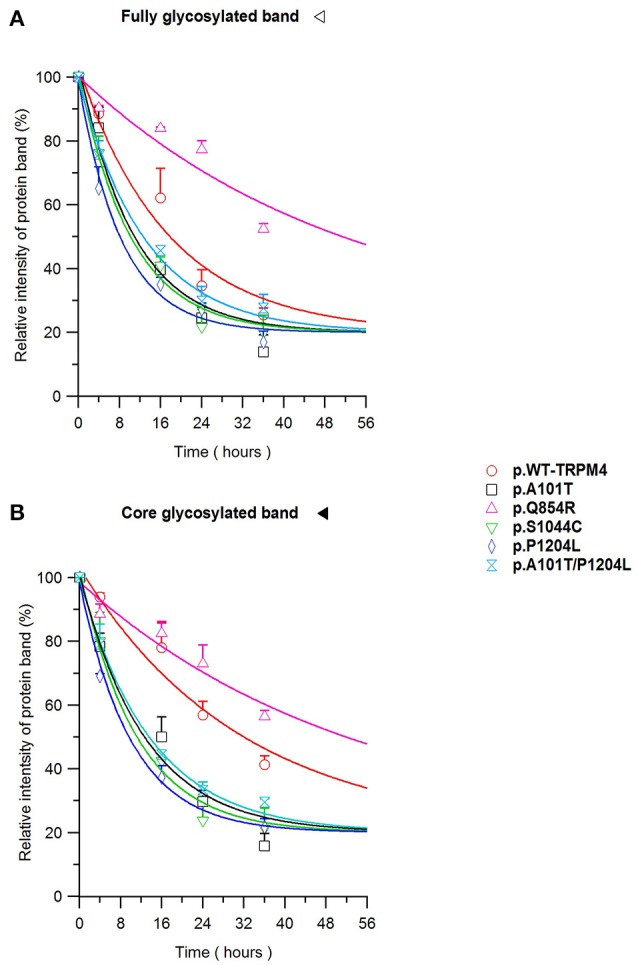
Figure 6.

TRPM4 protein expression decay. Immunoblots from Figure 5 are quantified as relative intensity of protein band of the fully (A) and the core (B) glycosylated band. 0.3% DMSO values are used at each time point for normalization. Statistical analysis has been performed using one-way ANOVA and results are shown in Supplementary Table 1.
