
FIGURE 3.
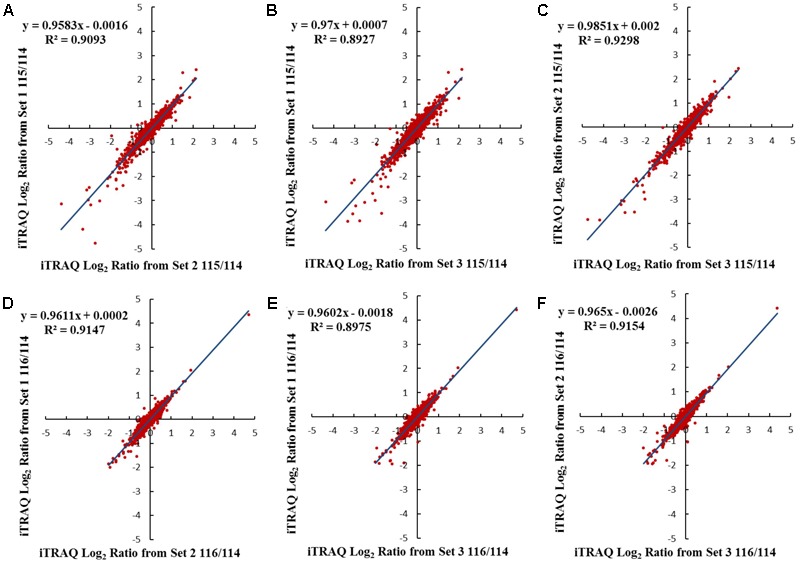
Comparison of log2 iTRAQ ratio (115/114 and 116/114) for 1,834 proteins identified in all three Dajiao biological replicates: set1, set2, and set3. Plots of 115/114 or 116/114 ratios for each of the quantified proteins between two of the three sets generated comparable quantification results, as determined by a linear regression analysis that revealed a slope of around 0.96, 0.97, or 0.99 in Dajiao for 115/114, among the pairs of set1/set2 (A), set1/set3 (B), and set2/set3 (C), respectively. Similar plots were also conducted for the 116/114 ratio, yielding a slope of around 0.96, 0.96, or 0.97 in Dajiao, among the pairs of set1/set2 (D), set1/set3 (E), and set2/set3 (F), respectively.