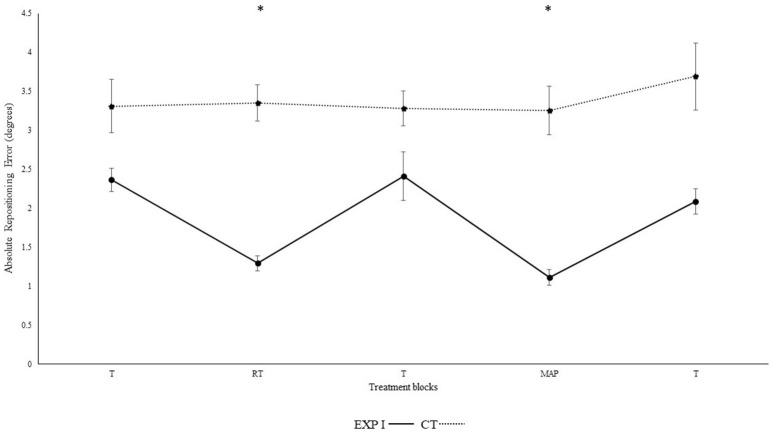
Figure 1.
Absolute mean and standard error of repositioning error (°) for the control, experimental group I (Dotted line represents control group. Darkened black line represents experimental group I, T: Proprioceptive test without auditory feedback, RT: Real-time auditory feedback, MAP: Acoustic mapping, CT: Control group, EXP: Experimental group). *Represents significant differences.

