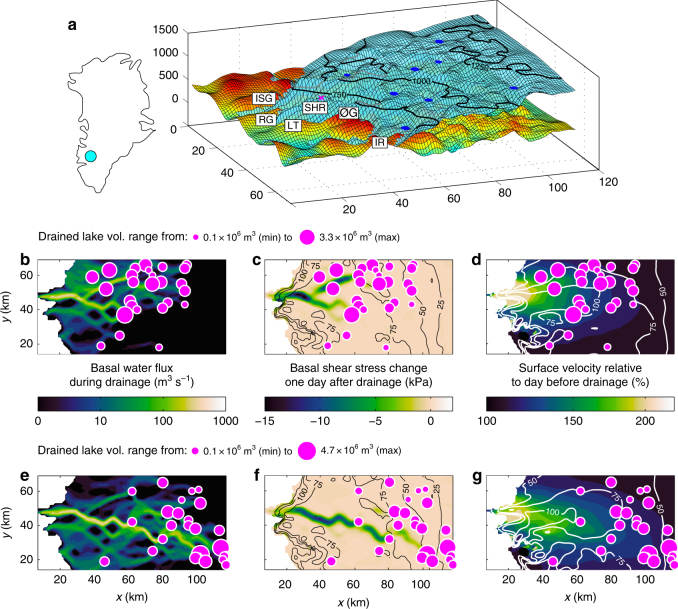
Fig. 1.
Cascading supraglacial lake drainage events. a Numerical model of the Kangerlussuaq sector of the Greenland Ice Sheet, including Isunnguata Sermia (ISG), Russell Glacier (RG), Leverett Glacier (LT), Ørkendalen Glacier (ØG), Isorlersuup Glacier (IR) and site SHR on the K-transect. b Flux of water in the basal drainage network on 21 June when 26 lakes drained rapidly. Solid magenta dots denote location and volume of lakes, which lost between 0.1 and 3.3 million cubic metres of water when they drained. c Change in basal shear stress one day after drainage when the ice sheet has responded to the lubrication of flow by surface water injected at the bed. Black contours show absolute values of basal shear stress prior to drainage. d Surface velocity relative to day before drainage. White contours show absolute values of surface velocity prior to drainage. e–g same as b–d but for cascading lake drainage on 18 July

