
Figure 1.
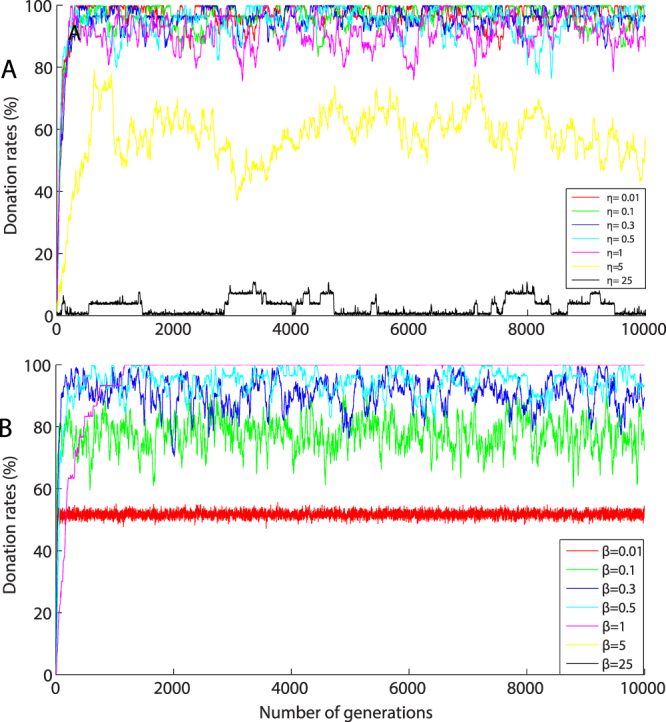
(A) and (B) depicts donation rates as a function of number of generations for particular β and η values. Each colour-coded trajectory represents the evolution of donation rates over 10,000 generations for each experimental condition with a population size of 100. (A) Shows that when β = 0.5 and 0.01 < η < 5 high levels of cooperation are achieved and when η is high, the donation rates drop to 0%. (B) Shows that when η = 0.5 and 0.01 < η < 2 high levels of cooperation are achieved and when β is high, the donation rates drop to 0%.