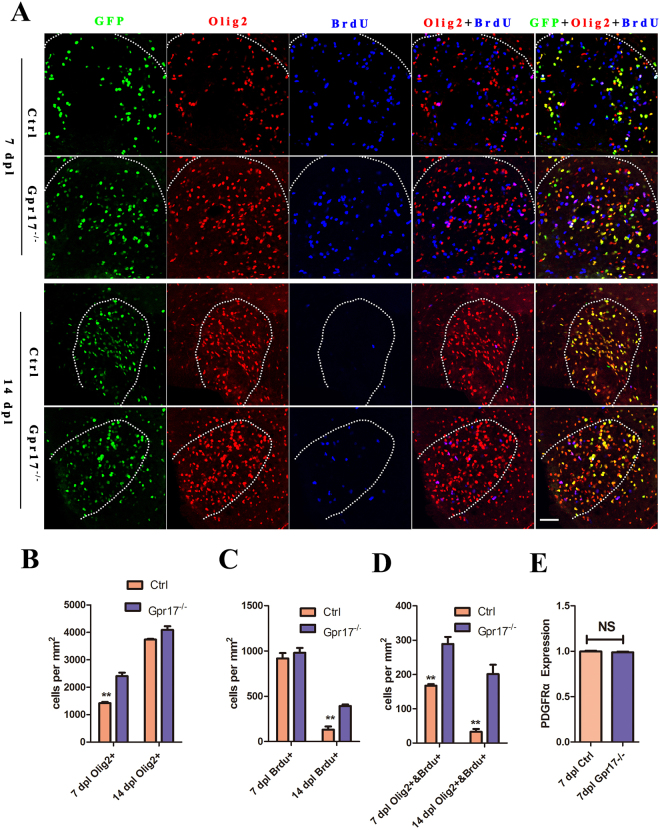
Figure 4.
The expression of Olig2 proliferation was increased in lesion regions in Gpr17−/− mice. (A,B) and (C) Immunostaining and quantification of for expression of OL lineage cells marker Olig2 and BrdU in lesion regions at 7 dpl and 14 dpl in spinal cords of 8-week-old control and Gpr17−/− mice; n = 3 animals for each genotype. White dashed line demonstrates lesion borders. (D) Quantitative real-time PCR (qRT-PCR) analysis of OPCs marker PDGFRa expression in lesion regions. n = 3 animals for each genotype. Student’s t-test. Data are presented as Mean ± SEM. **P < 0.01; Scale bar: 50 μm.

