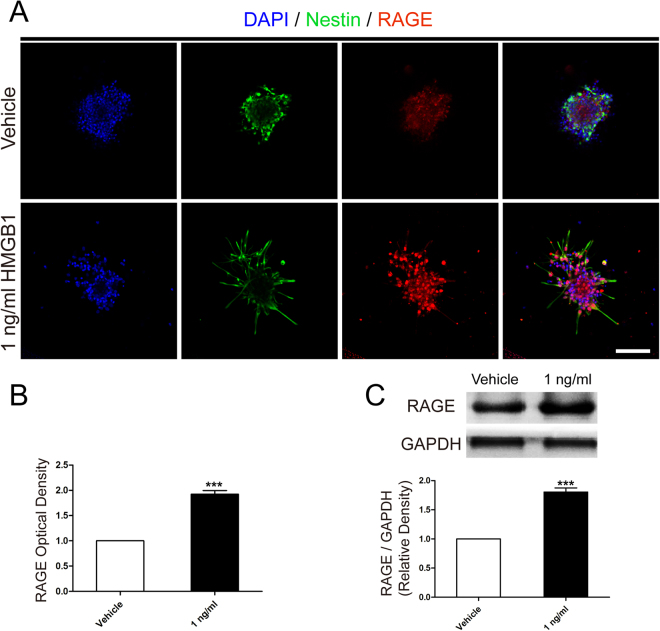
Figure 4.
HMGB1 (1 ng/ml) upregulated RAGE expression. (A) The immunostaining images indicated RAGE expression (red) in vehicle or 1 ng/ml HMGB1. Cell nuclei were stained with DAPI in blue. Scale bar: 20 µm. (B) Bar graphs summarized semi-quantitative results from (A). ***P < 0.01, Mann-Whitney U test (n = 3 for each group). (C) Western blot assays indicated the different expression level of RAGE in vehicle or 1 ng/ml HMGB1 after migration for 24 hours. Bands were cropped from different parts of the same gel and analyzed using the Image Lab™ software for relative density and normalized to GAPDH control. ***P < 0.01, Mann-Whitney U test (n = 3 for each group). Scale bar: 100 µm.

