Figure 5.
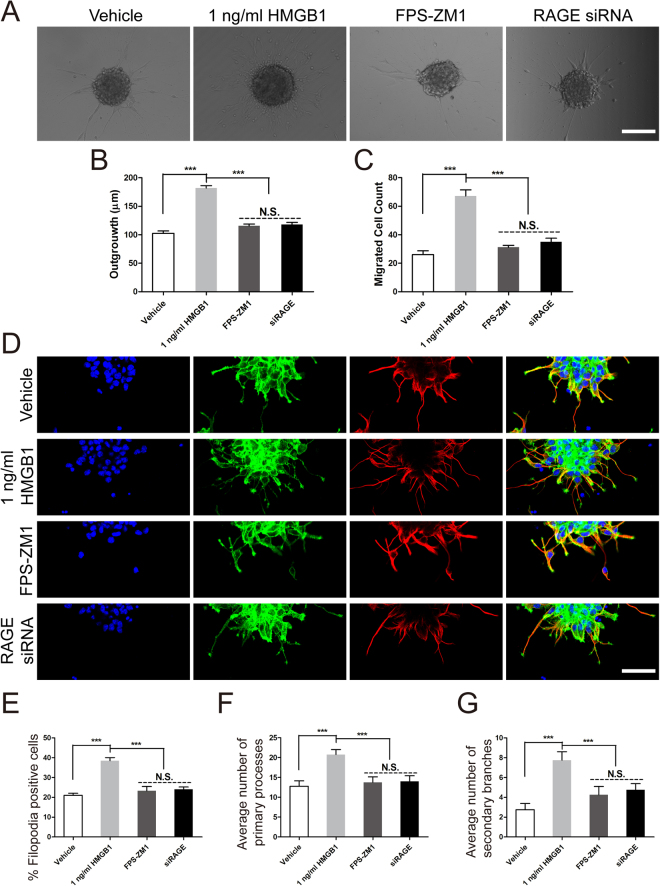
RAGE played a pivotal role in NSCs migration elicited by HMGB1. (A) The role of RAGE in NSCs migration induced by 1 ng/ml HMGB1. Neurospheres were incubated in vehicle, 1 ng/ml HMGB1, 50 nM FPS-ZM1, or siRAGE for 24 hours in PLO pre-coated 24-well plates and images were captured by phase contrast microscopy after 24 hours. Scale bar: 100 µm. (B) Quantitative analysis of migration distance from neurospheres. ***P < 0.01, one-way ANOVA followed by Tukey’s post hoc test (n = 3 for each group). (C) Summarized graph indicated the number of migration cells from neurospheres. ***P < 0.01, one-way ANOVA followed by Tukey’s post hoc test (n = 3 for each group). (D) The effect of RAGE on filopodia formation using phalliodin staining (green) and the cage-like microtubule structure with tubulin immunostaining (red) in neurospheres in different groups, respectively. (E) Bar graph indicated the percent of filopodia formation. ***P < 0.01, one-way ANOVA followed by Tukey’s post hoc test (n = 3 for each group). Scale bar: 20 µm. (F) Quantitative analysis of average number of primary leading processes. ***P < 0.01, one-way ANOVA followed by Tukey’s post hoc test (n = 3 for each group). (G) Quantitative analysis of average number of secondary branches. ***P < 0.01, one-way ANOVA followed by Tukey’s post hoc test (n = 3 for each group).

