Fig. 2.
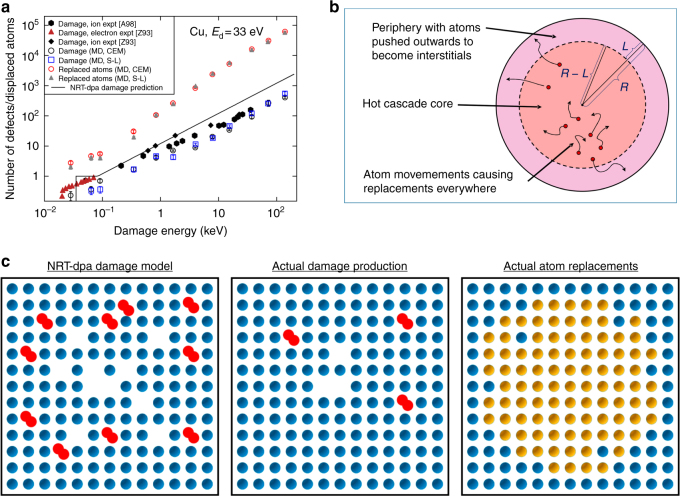
Problem with NRT-dpa. a Experimental and simulation data showing quantitatively the problem with the NRT-dpa equation. In the figure, ‘expt’ stands for experimental data, and ‘MD’ for simulated molecular dynamics data. The other abbreviations denoted different interatomic potentials. The references are: [A98]: ref. 26, [Z93]: ref. 13. The Cu MD data is original work for this publication, see Methods section. The figure shows that the NRT-dpa equation does not represent correctly either the actual damage (Frenkel pairs produced) nor the number of replaced atoms. The former is overestimated by roughly a factor of 3, and the latter underestimated by a factor of 30. b Schematic of the concepts and quantities used in deriving the new arc-dpa and rpa equations. c Schematic illustration of the damage predicted by the three different damage models for the case of ~1 keV damage energy in a typical metal. For illustration purposes, the damage is illustrated as if all damage were produced in the same two-dimensional plane. Blue circles illustrate atoms in original lattice positions, yellow-brown denotes atoms that are in a different lattice position after the damage event, red atom pairs denote two interstitial atoms sharing the same lattice site, and empty lattice positions denote vacancies. Left: Damage production predicted by the NRT-dpa model. Middle: actual damage production, addressed by the new arc-dpa equation. Right: actual atom replacements, addressed by the new rpa equation, agreeing better with experimental data on number of replaced atoms (ion beam mixing). Note that in real three-imensional systems, the difference is even larger than in this 2D schematic

