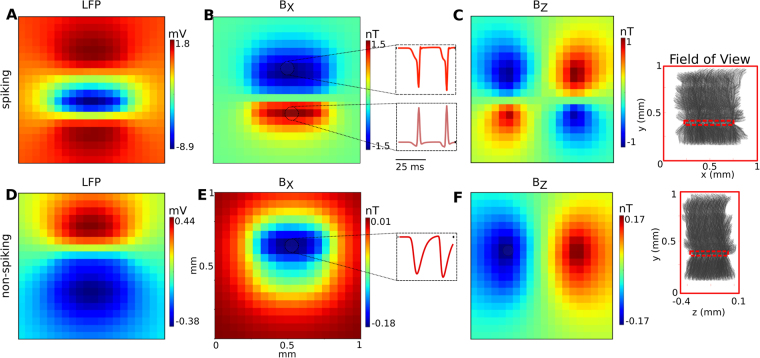
Figure 3.
Simulation results showing the spatial distribution and the temporal shape of the extracellular fields for the CA1 subarea for the spiking case (top row, A–C) and the non-spiking case (bottom row, D–F). The insets on the right depict the size, positions and orientation of the pyramidal cells in relation to the imaged field of view. The spatial distributions are extracted at the time point when the field peaks. (A) The LFP for the spiking case has a large negative peak close to the soma layer, as the generation of the action potentials causes a strong current inflow. (B) BX component of the magnetic field. The generation of the action potentials creates separate strong axial current flows in opposite directions from the S.O. and S.R. dendrites to the soma of the pyramidal cells, which leads to a negative peak in S.R. and positive peak in S.O. regions. (C) BZ component of the magnetic field in accordance to the two opposite axial current flows from the S.O. and S.R. dendrites to the soma regions. The insets in the center depict the temporal shapes of the magnetic field components, extracted from the indicated positions above and below the pyramidal layer (a time window of 50 ms is shown). The initial phases before the action potentials reflect the accumulation of excitatory postsynaptic potentials (EPSPs). (D) The LFP for the non-spiking case has a dipolar distribution, with the negative peak caused by the EPSPs in the S.O. region and the positive peak above S.R. region caused by outward membrane currents which balance the excitatory synaptic currents. (E) BX component of the magnetic field. It has a large peak around the soma, indicating an axial current flow from the S.R. to the S.O. region. (F) BZ component of the magnetic field in accordance to the axial current flow from S.R. to S.O. The temporal shapes depicted in the insets reflect the accumulation of EPSPs.

