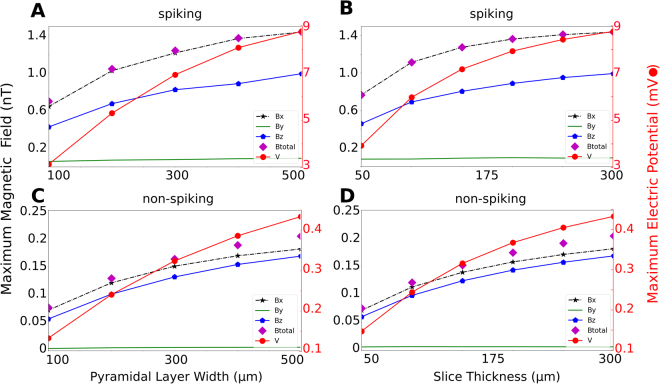
Figure 4.
Dependence of the maximum field strength on the size of the active CA1 subarea. The distance of the active subarea to the sensor surface is 50 µm in all simulations. (A) Spiking case. The width of the subarea is varied from 100 µm to 500 µm, the thickness is 300 µm. (B) Spiking case. The thickness of the subarea is systematically varied from 50 µm to 300 µm, the width is 500 µm. (C) Non-spiking case. The width of the subarea (X direction in Fig. 1B) is varied from 100 µm to 500 µm, while the thickness is held constant at 300 µm. (D) Non-spiking case. The thickness of the subarea (Z direction in Fig. 1B) is systematically varied from 50 µm to 300 µm. The width is held constant at 500 µm.

