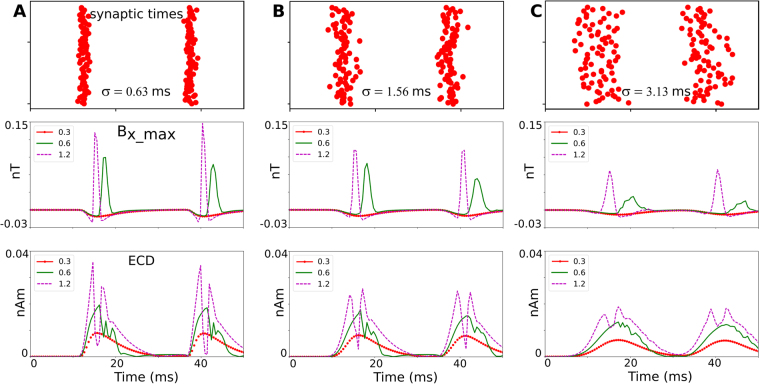
Figure 5.
Dependence of the field strength on the temporal synchrony of the EPSPs and on the simulated strength of the glutamatergic synapses. A sublayer is simulated that contains 200 cells and has a width of 100 µm, a height of 50 µm, and a minimal distance of 150 µm to the diamond surface. The time points of the synaptic excitations are jittered in time using a Gaussian profile, determined by a standard deviation σ. The synaptic strengths were varied between 0.3 nS (resulting in non-spiking activity), 0.6 nS (resulting in just stable spiking activity) and 1.2 nS (resulting in more synchronous spiking). The top row depicts the temporal distribution of the synaptic excitations. The middle row shows the time course of the BX component of the magnetic field, extracted at the spatial peak position. The bottom row shows the time course of the equivalent current dipole (ECD), again extracted at the spatial peak position. (A) Results for highly synchronous synaptic excitations (σ = 0.63 ms), (B) Synchronous synaptic excitations (σ = 1.56 ms) and, (C) Weakly synchronous excitations (σ = 3.13 ms).

