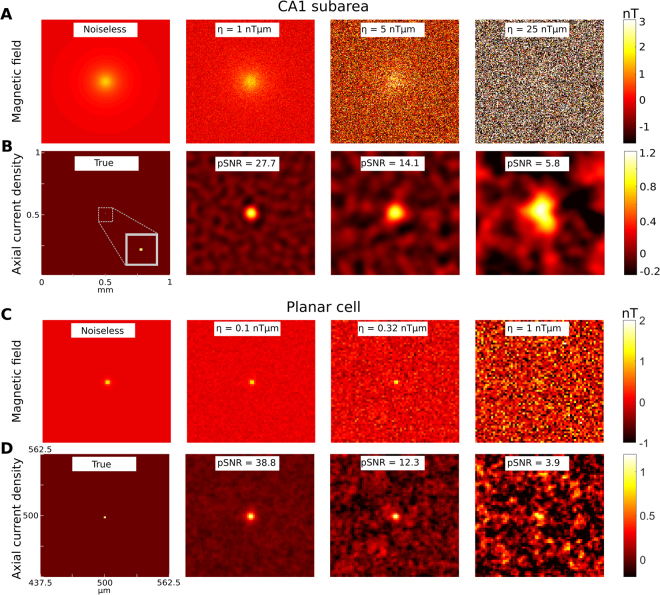
Figure 8.
Examples of reconstructed neural axial current densities at varying pSNR levels. (A) Recording from the CA1 subarea. A neural point source with 50 µm distance to the diamond plane and a length of 300 µm oriented in Z direction is simulated. It injects a constant current density JY in Y direction across its complete height. The strength of the source is chosen so that a peak magnetic field strength of 1.5 nT is reached in the sensor plane. The in-plane resolution of the sensor is set to 7.8 µm (128 × 128 pixels in 1 mm2). The BX component of the measured magnetic field is shown for the noiseless case and for three different levels of the signal-to-noise power of the recorded magnetic field. (B) The normalized axial current densities reconstructed from the corresponding magnetic fields shown in (A). Each plot is normalized to the maximum of its noiseless reconstruction with the same spatial filter settings. (C) Recording of a planar cell. A neural point source with 1 µm distance to the diamond and a length of 2 µm is simulated. Its strength is chosen to give a peak magnetic field strength of 2.5 nT in the sensor plane. The BX component of the measured magnetic field is shown for the noiseless case and for three different levels of the signal-to-noise power. The in-plane resolution of the sensor is set to 2 µm (512 × 512 pixels in 1 mm2) and a field of view of 125 × 125 µm2 is selected for better visualization. Since the magnetic field is very localized, the “recorded” peak magnetic field strength is slightly lower than 2.5 nT due to spatial averaging in the 2 × 2 µm areas of the sensor pixels. (D) The normalized axial current densities reconstructed from the corresponding magnetic fields in (C). Each plot is normalized to the maximum of its noiseless reconstruction with the same spatial filter settings.

