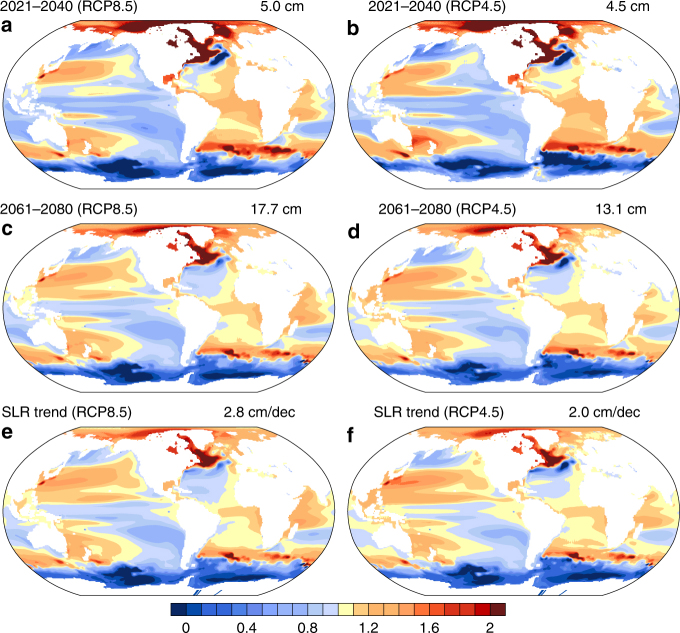
Fig. 1.
Ratio of ensemble averaged 20-year mean sea level rise and the decadal trend of sea level rise and the global mean. a–d The mean sea level rise and e, f the decadal sea level rise trend. The numbers on the top right of each panel are the ensemble global mean value, and shading in all panels have been divided by those global mean values which leads to a unitless shading pattern. For a–d, the ensemble global mean sea level rise is relative to the ensemble mean sea level of 1986–2005. The decadal trend is the average 10-year trend over the period 2006–2080. The left panels are for RCP8.5 and right panels for RCP4.5

