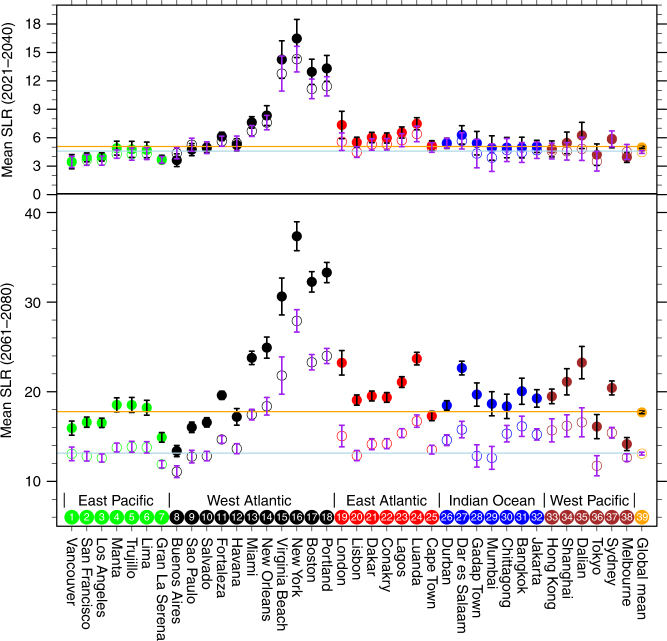
Fig. 2.
Twenty-year mean sea level rise for selected cities. This mean sea level rise is relative to the mean of the 1986–2005. The top is for the mean of 2021–2040 and the bottom for 2061–2080. The geographic location of these cities is given in Supplementary Fig. 7. The solid dots are the ensemble mean sea level rise for RCP8.5 and open circles the ensemble mean sea level rise for RCP4.5. The bars indicate ensemble variability (±1 standard deviation). The units are in centimeters. The brown and light blue line represent the ensemble global mean SLR for RCP8.5 and RCP4.5, respectively. The color coded dots/open circles represent east (green) and west (brown) Pacific coasts, west (black) and east (red) Atlantic coasts, and Indian Ocean coast (blue)

